How to Join Two Layers
In this guide we’ll show you how to join two layers. To join 2 layers, your layers will need a
shared attribute.
We’ll
use a working example of US election data.
The zip file below contains a US counties Shape file and a CSV file
containing 2024 US election results.
Time to complete: 20
mins.
Download the required dataset from the original provider before beginning this demonstration.
US County Boundaries - Download Source Data
US Presidential Election Results - Download/View Source Data 2024
Contents
1. Getting started
1.1 Import Datasets
1.2 Create Map
1.3 Import data onto your map
2. Join
your data
2.1 Using
the join data tool
2.2 Preview
joined data
2.3 Save
your new layer
3.
Style your new
layer (optional)
1. Getting started
1.1. Import Datasets
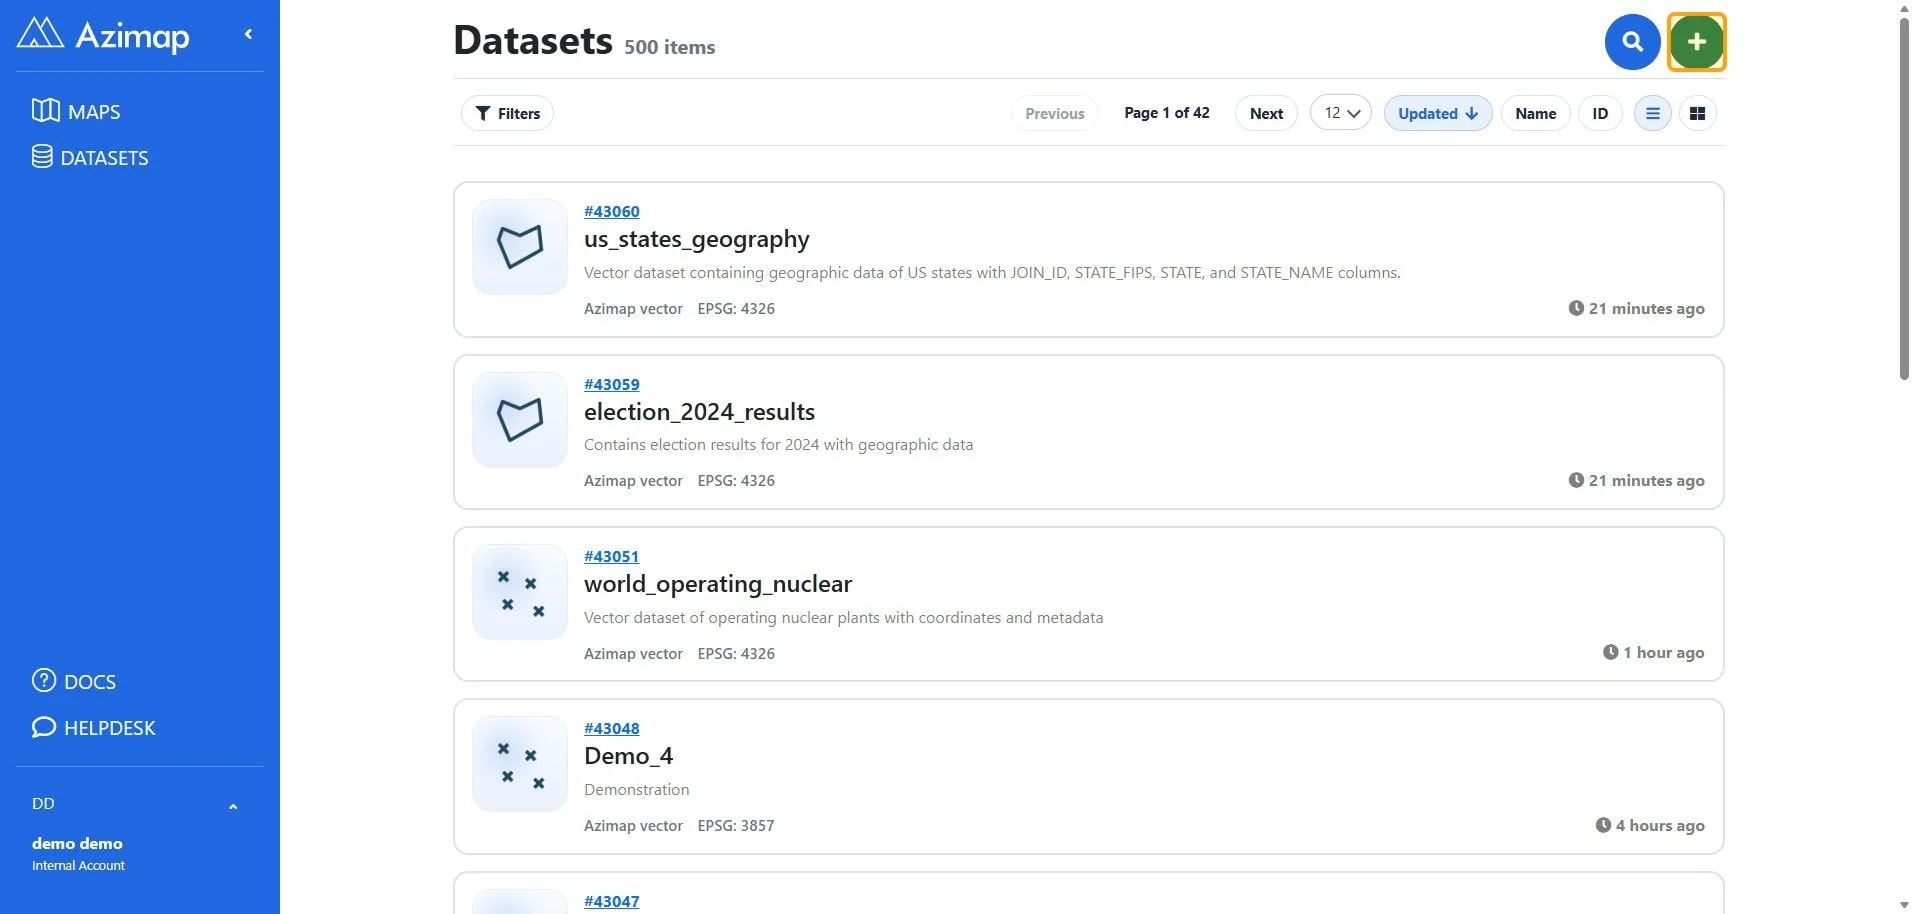
On the Datasets page, select Create dataset.
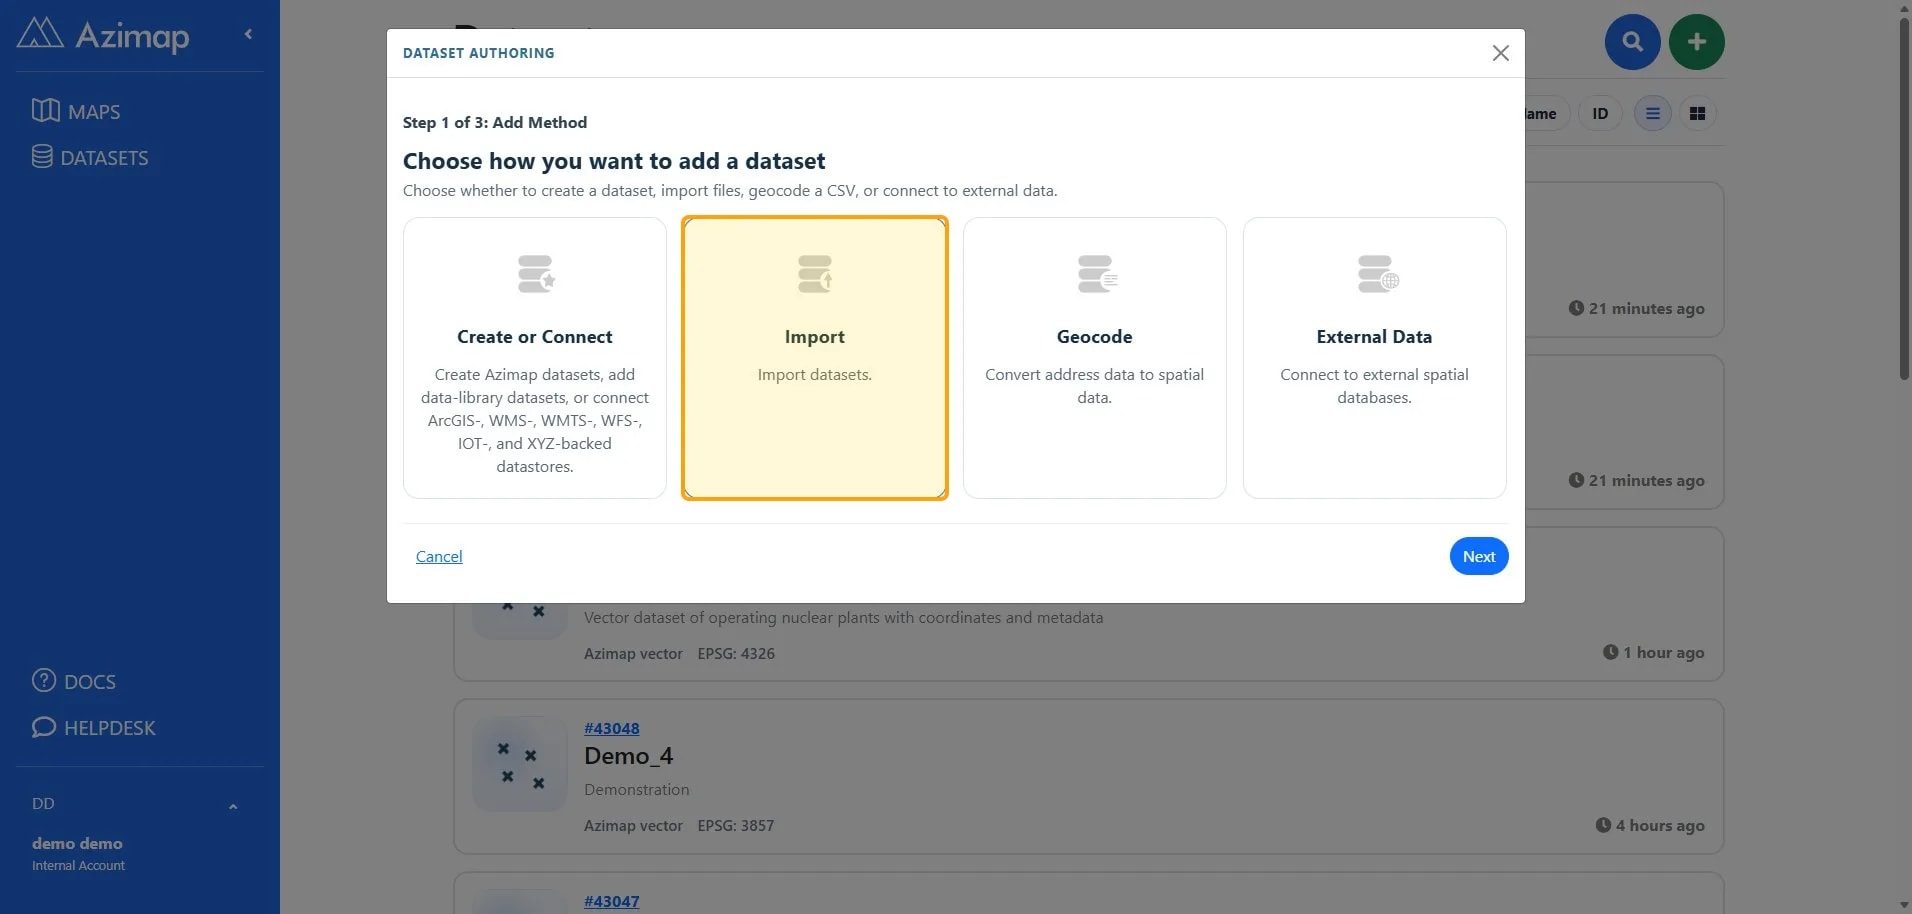
Choose Import.
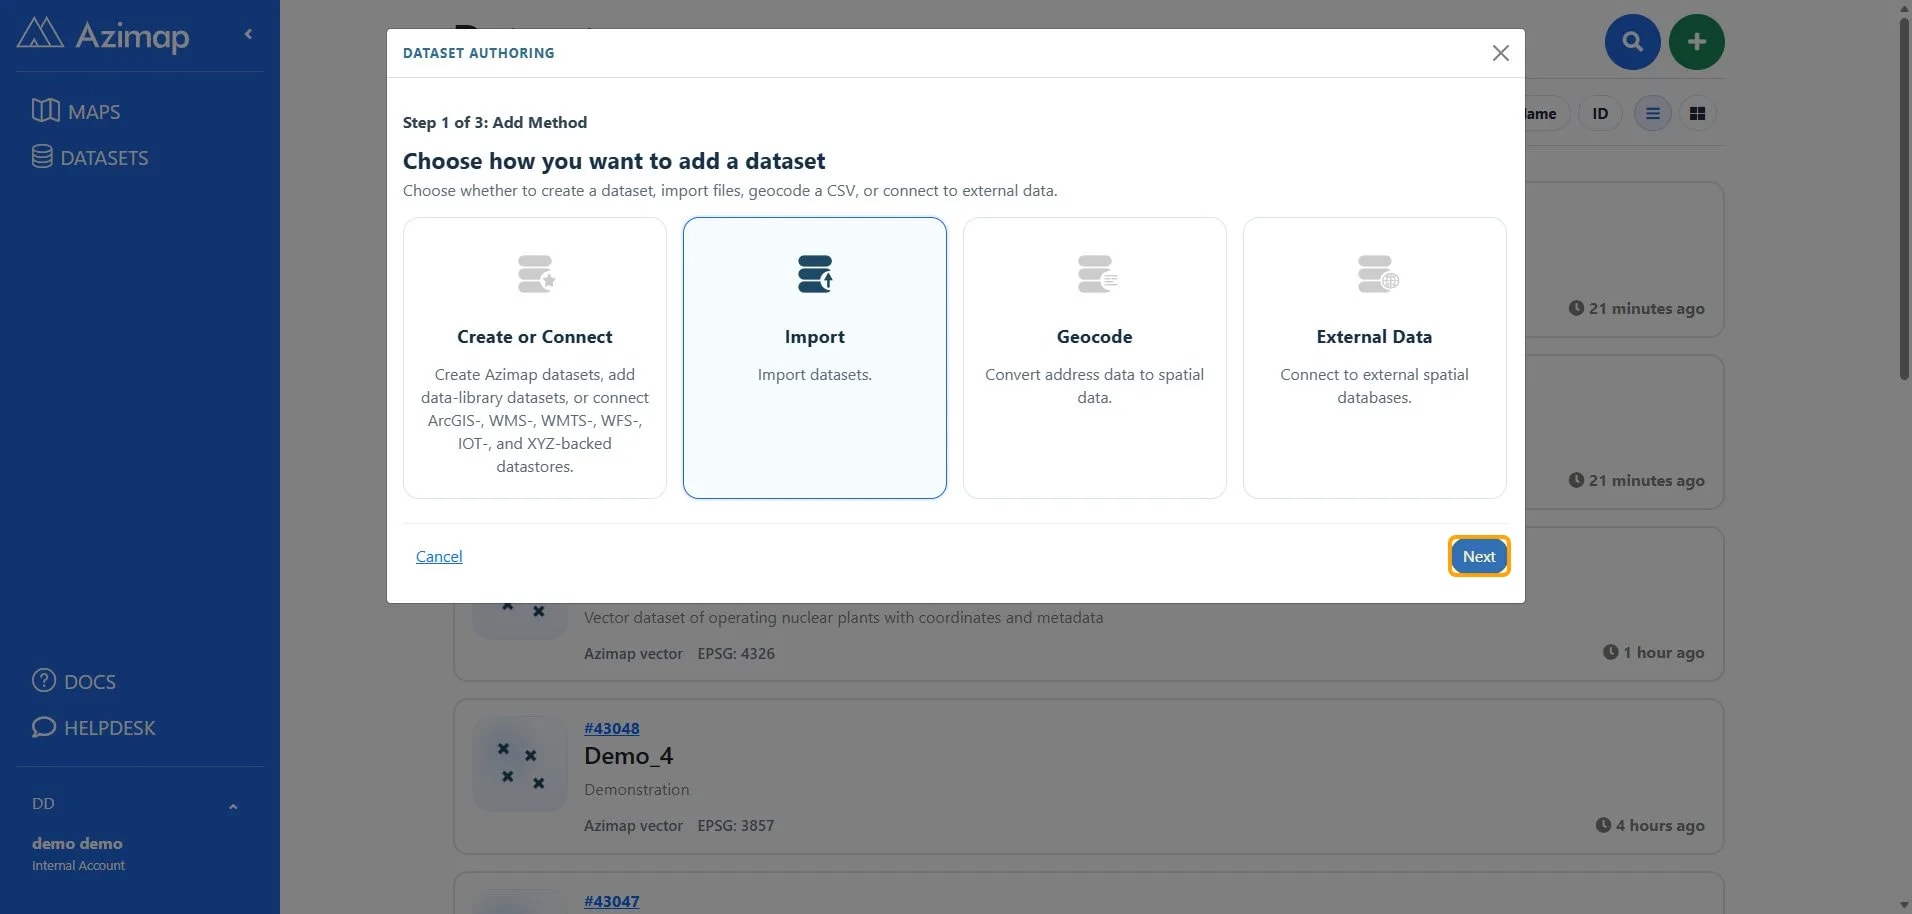
Select Next.
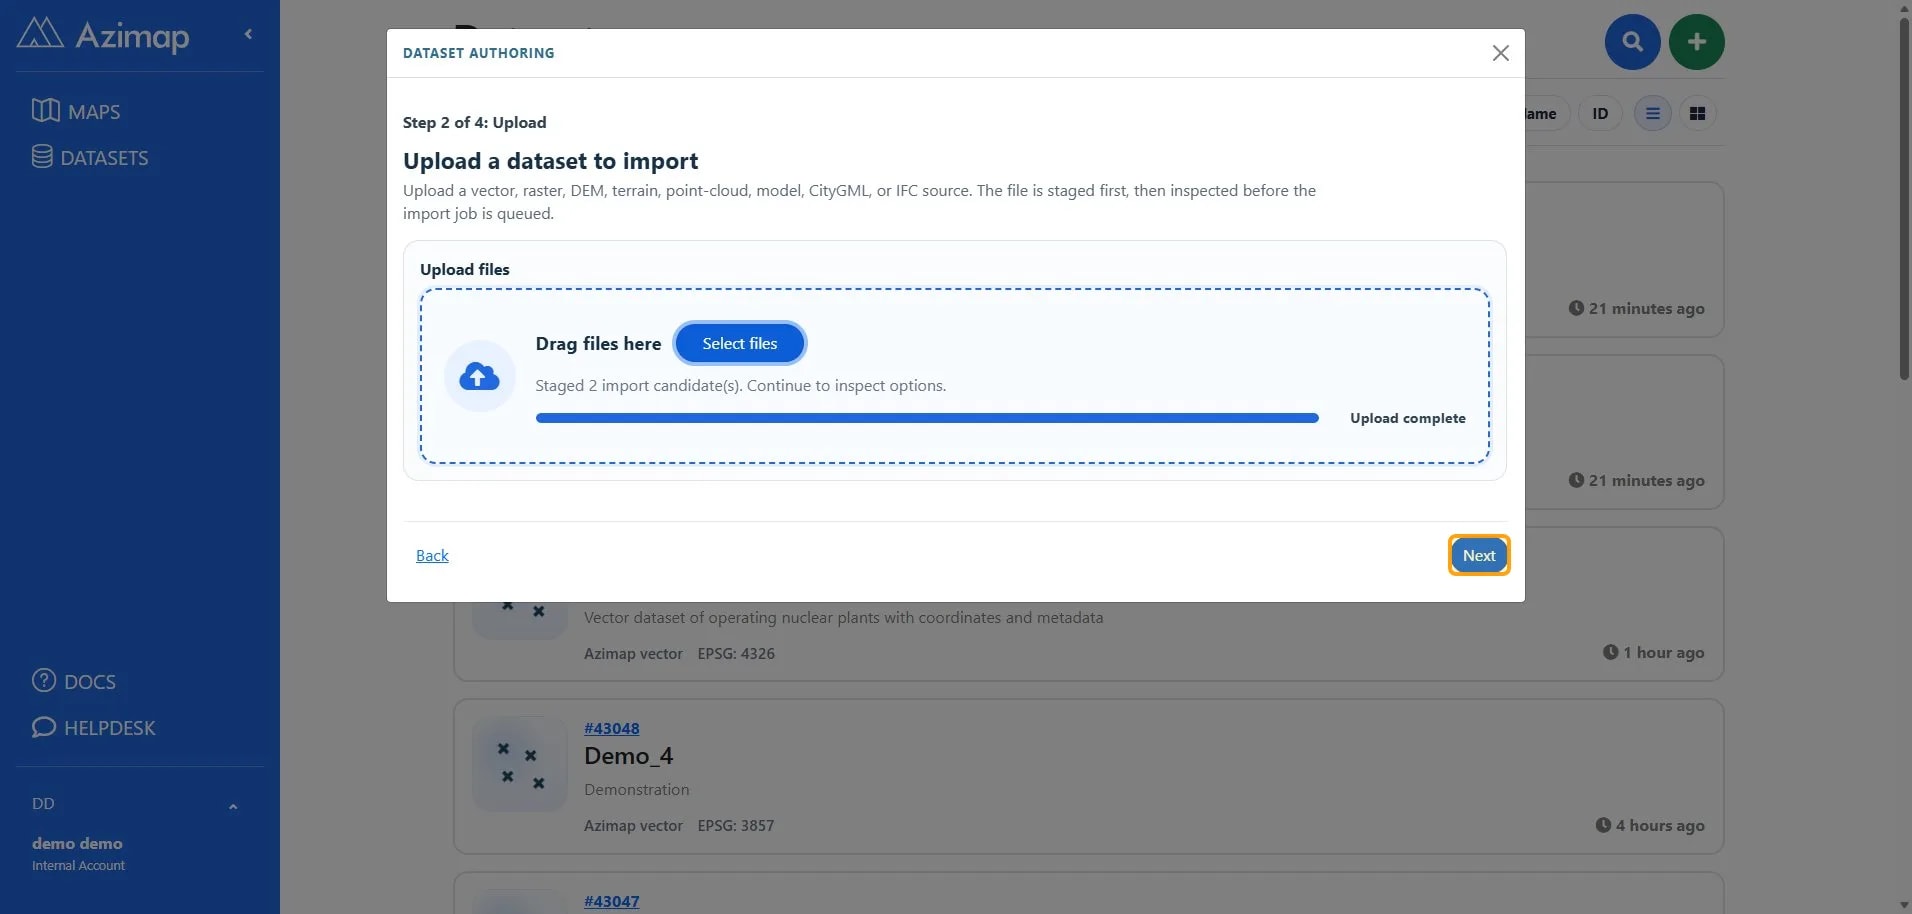
1.1.1. Upload the files?
Select Select files. Choose the election results CSV and
every file belonging to the state geography shapefile.
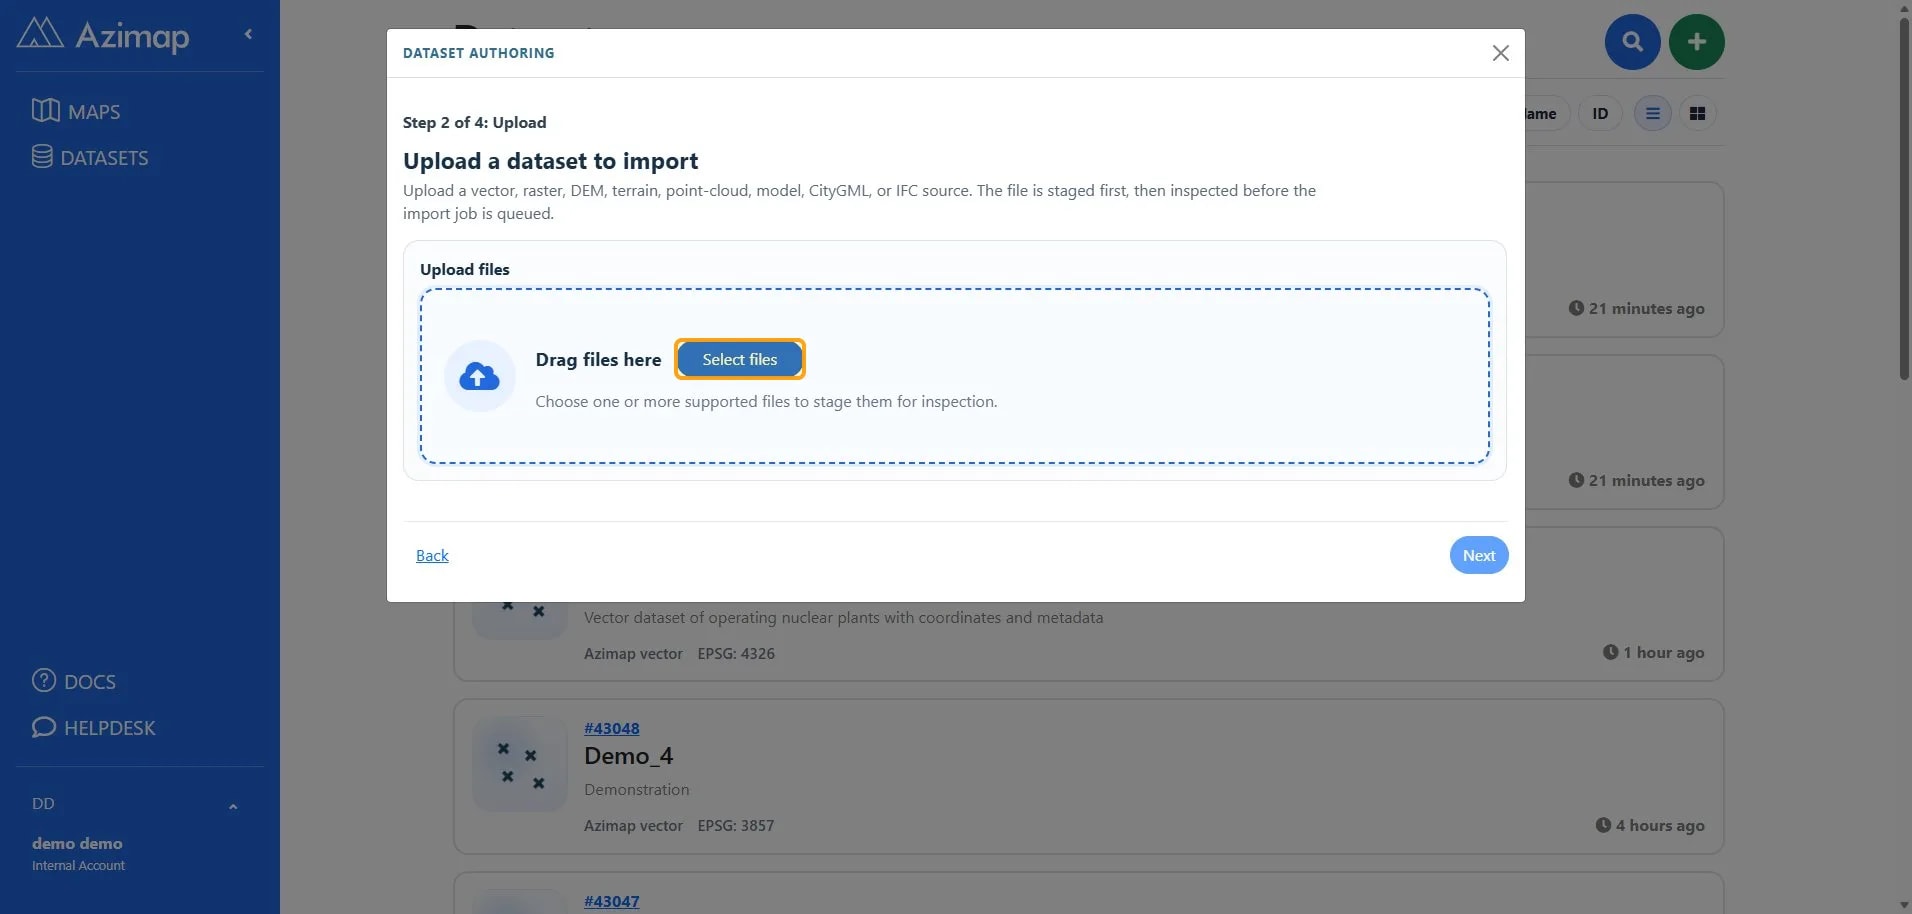
Wait for Upload complete, then select Next.
1.1.2. Confirm the projection and dataset names
Use Search projections to find the source coordinate
reference system.
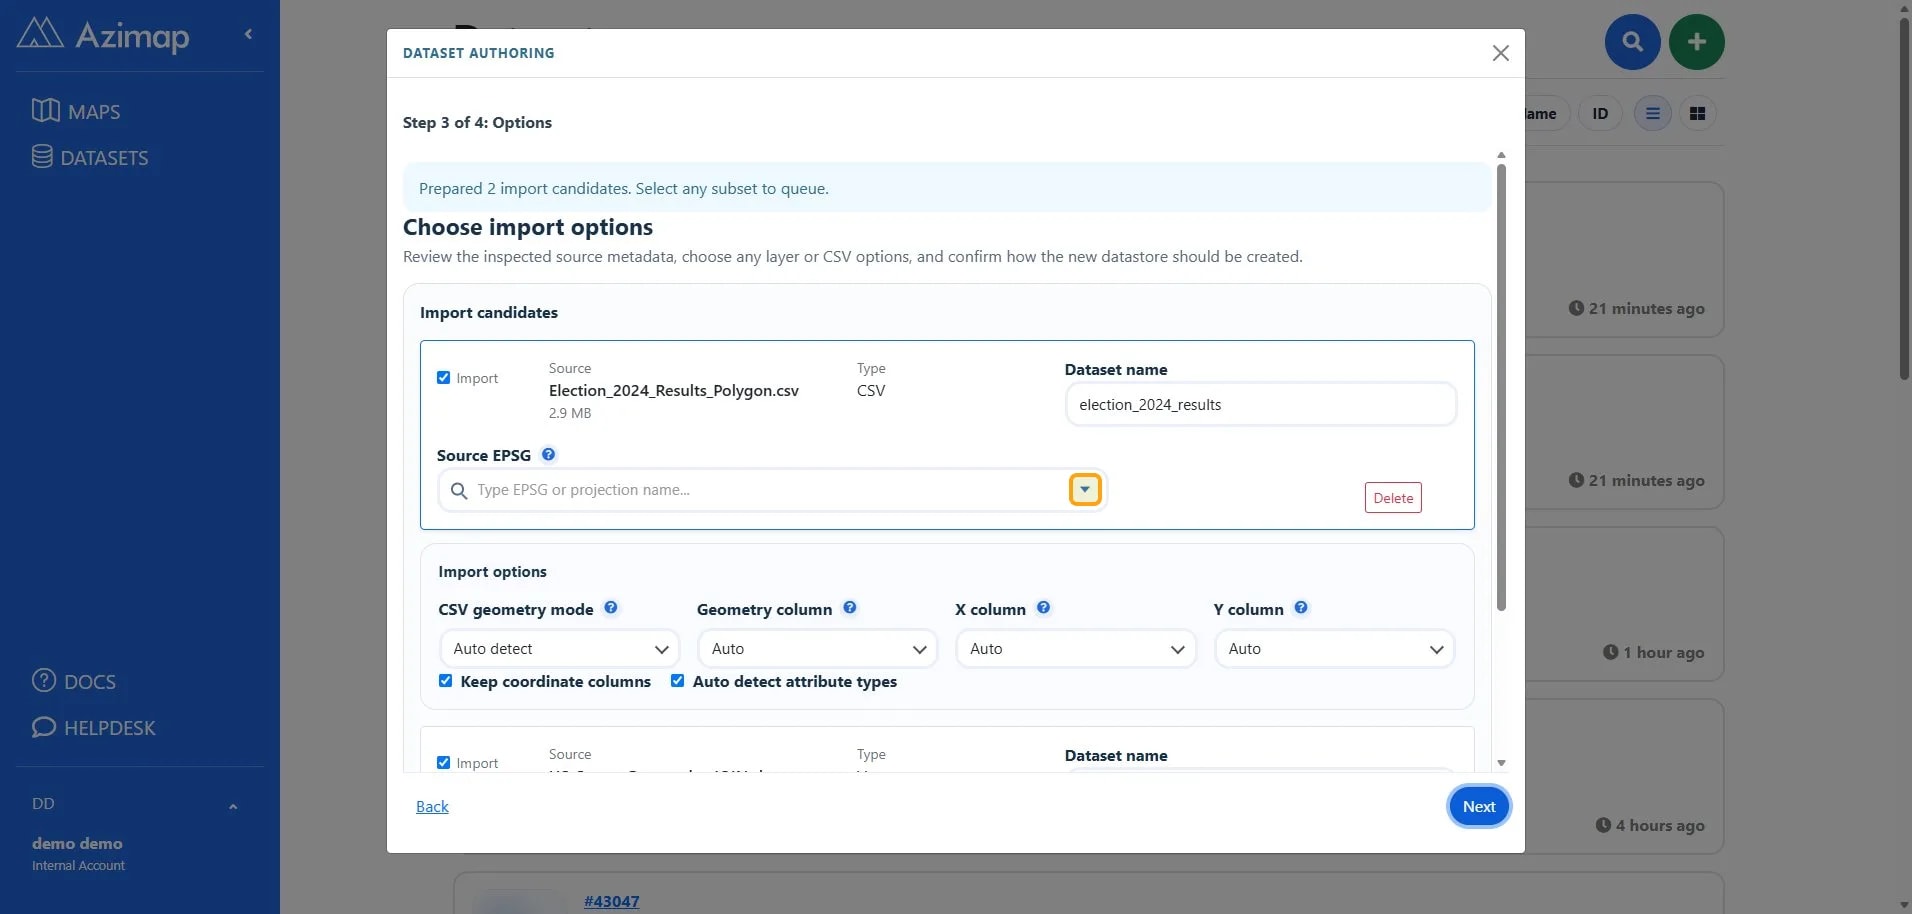
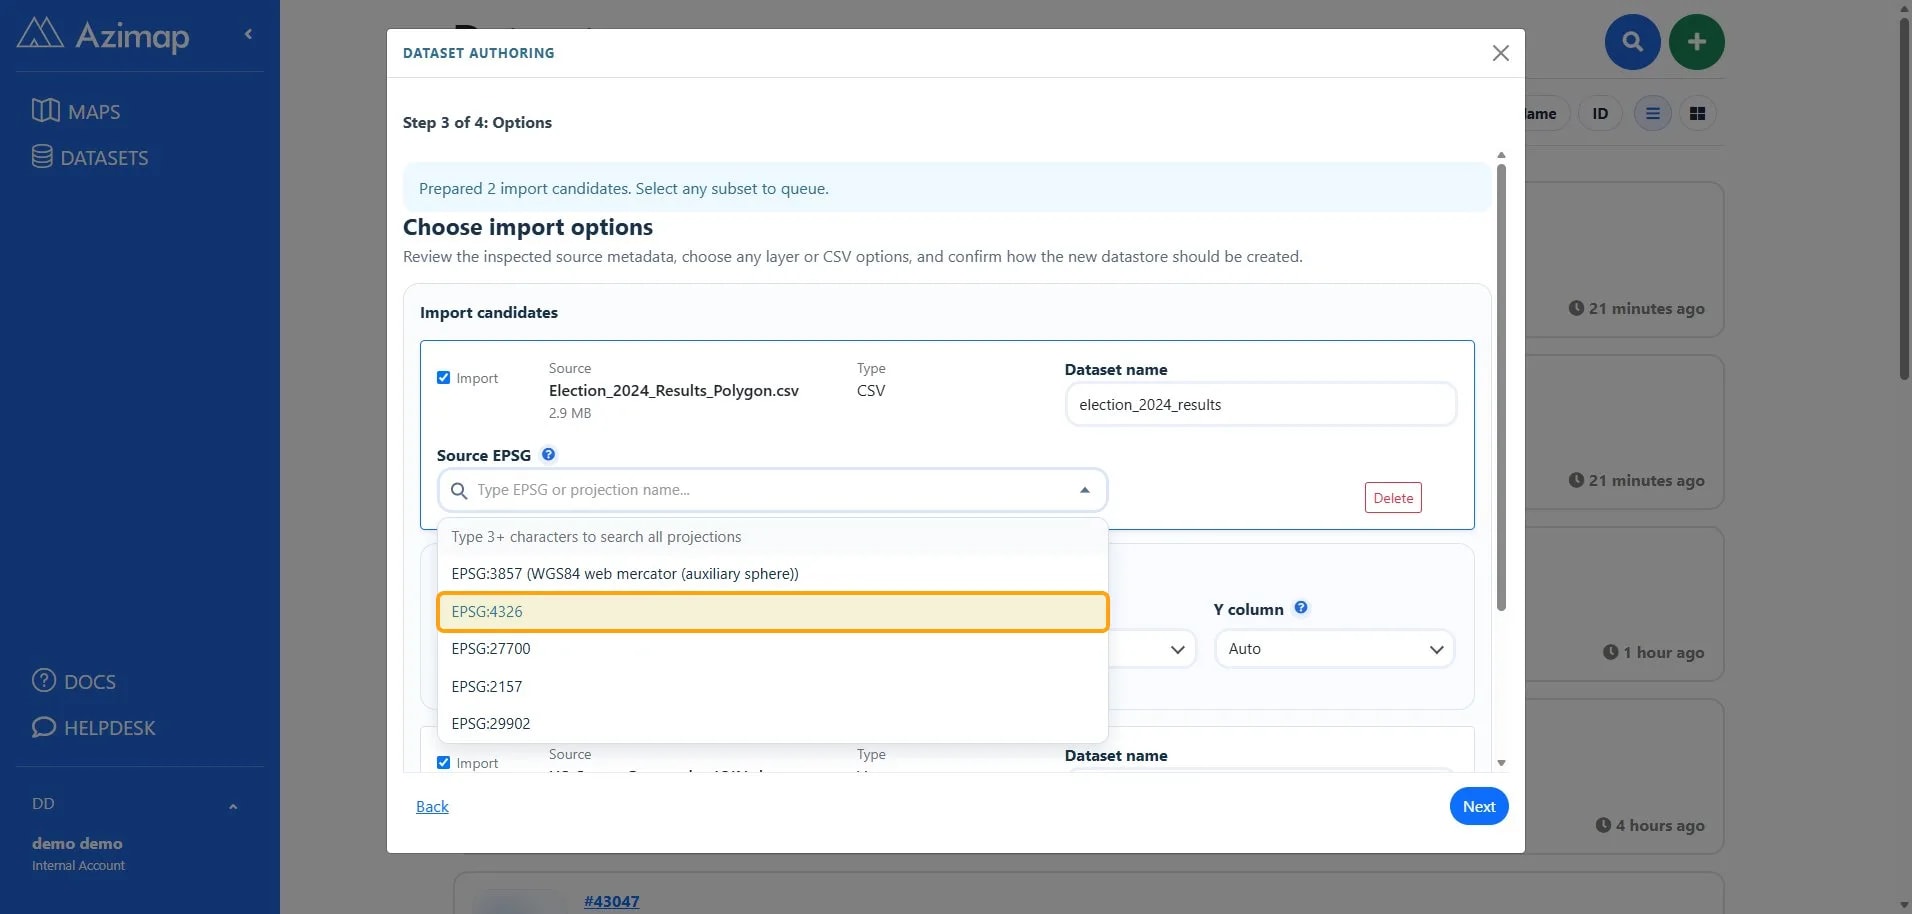
Choose EPSG:4326 for both import candidates.
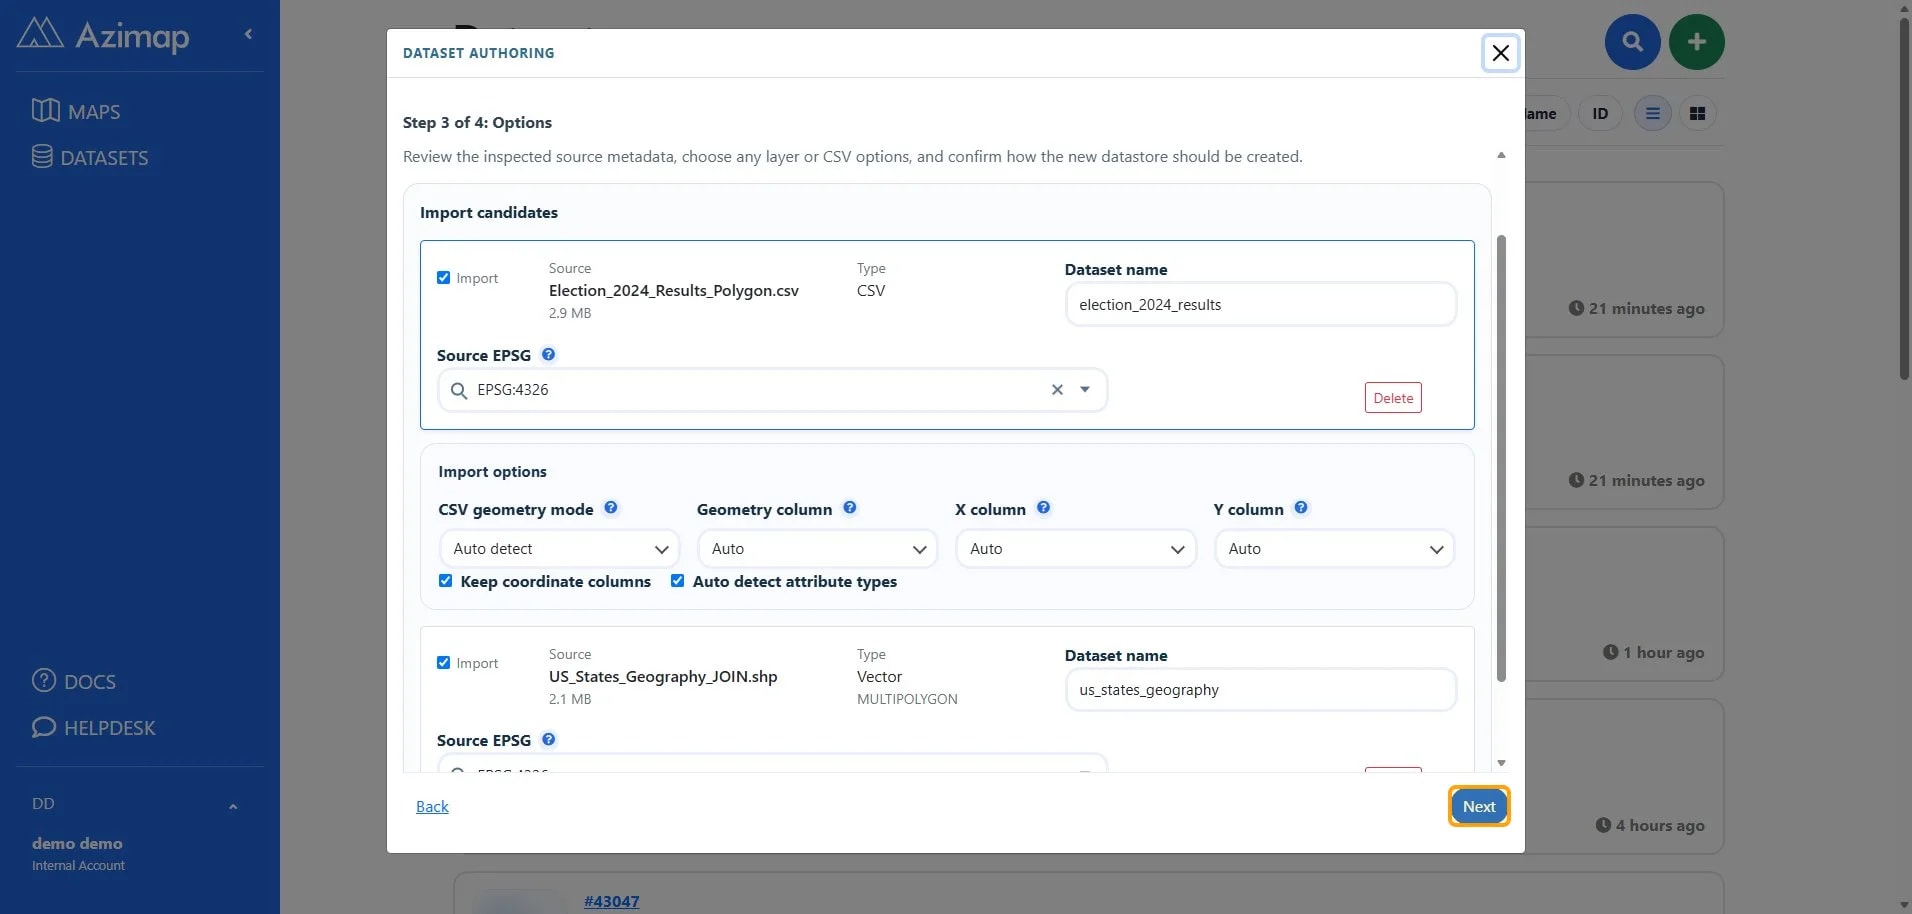
Confirm the dataset names are election_2024_results and
us_states_geography. Leave the other import options at their defaults unless
your data requires different geometry settings, then select Next.
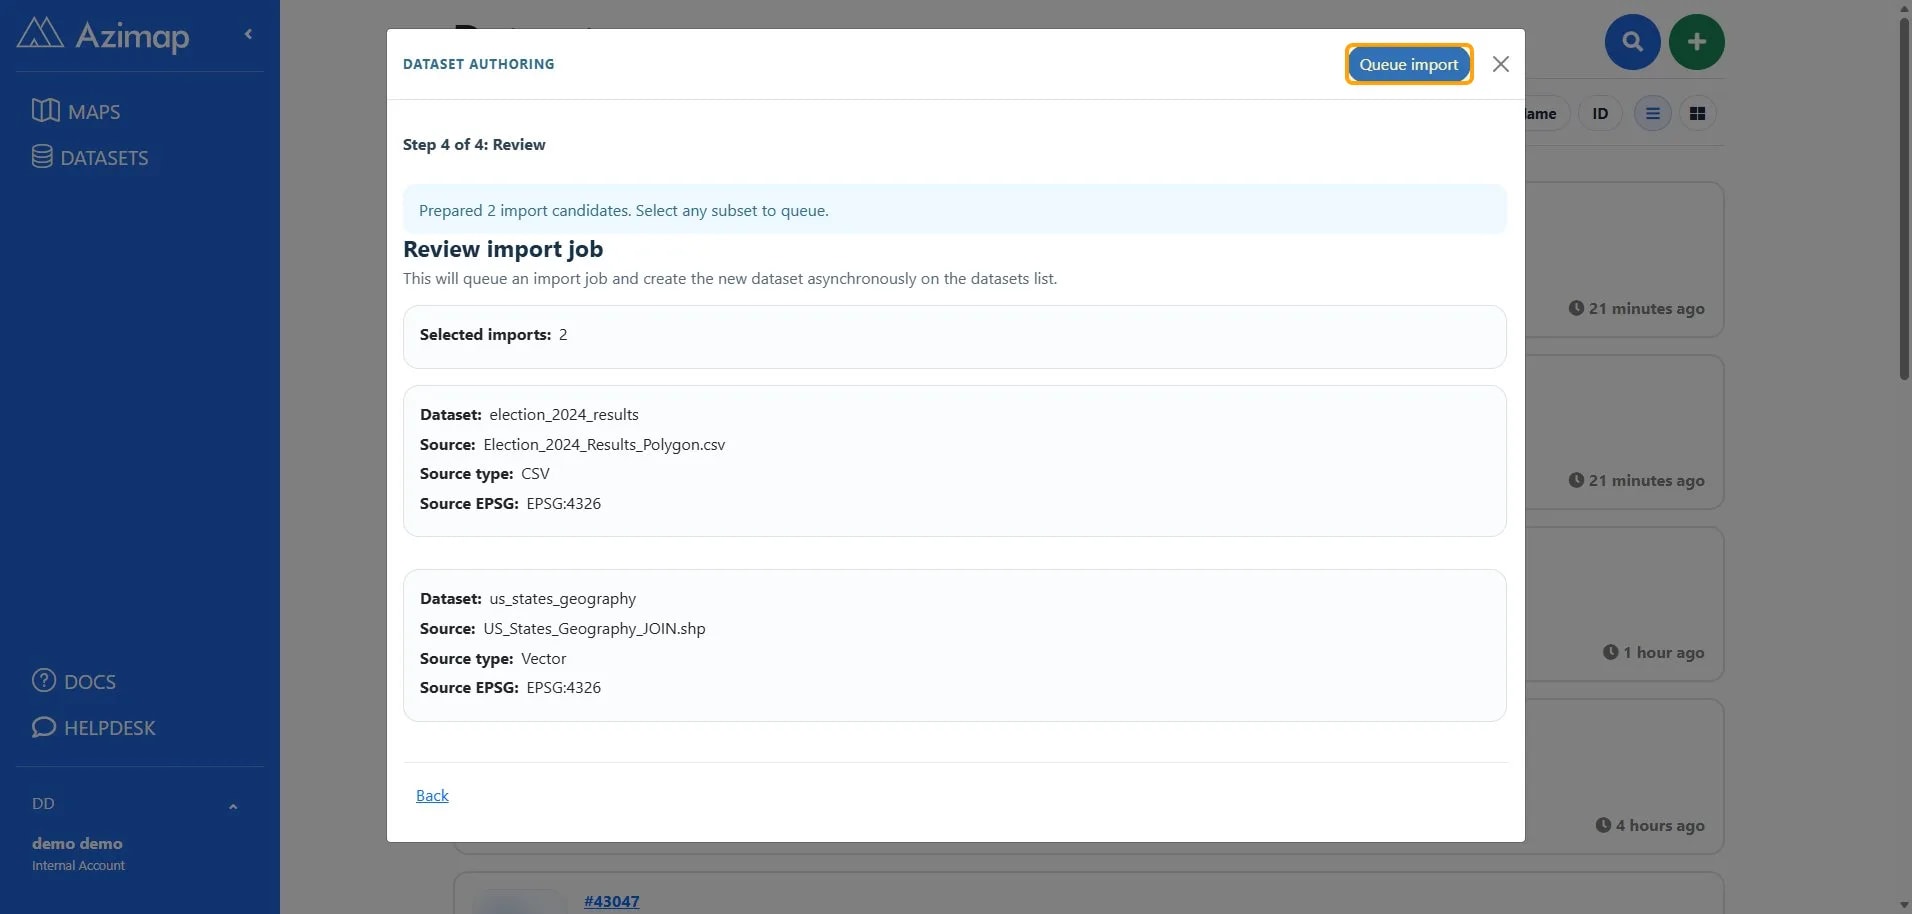
1.1.3 Queue the import
Check that both datasets and EPSG:4326 are listed, then
select Queue import.
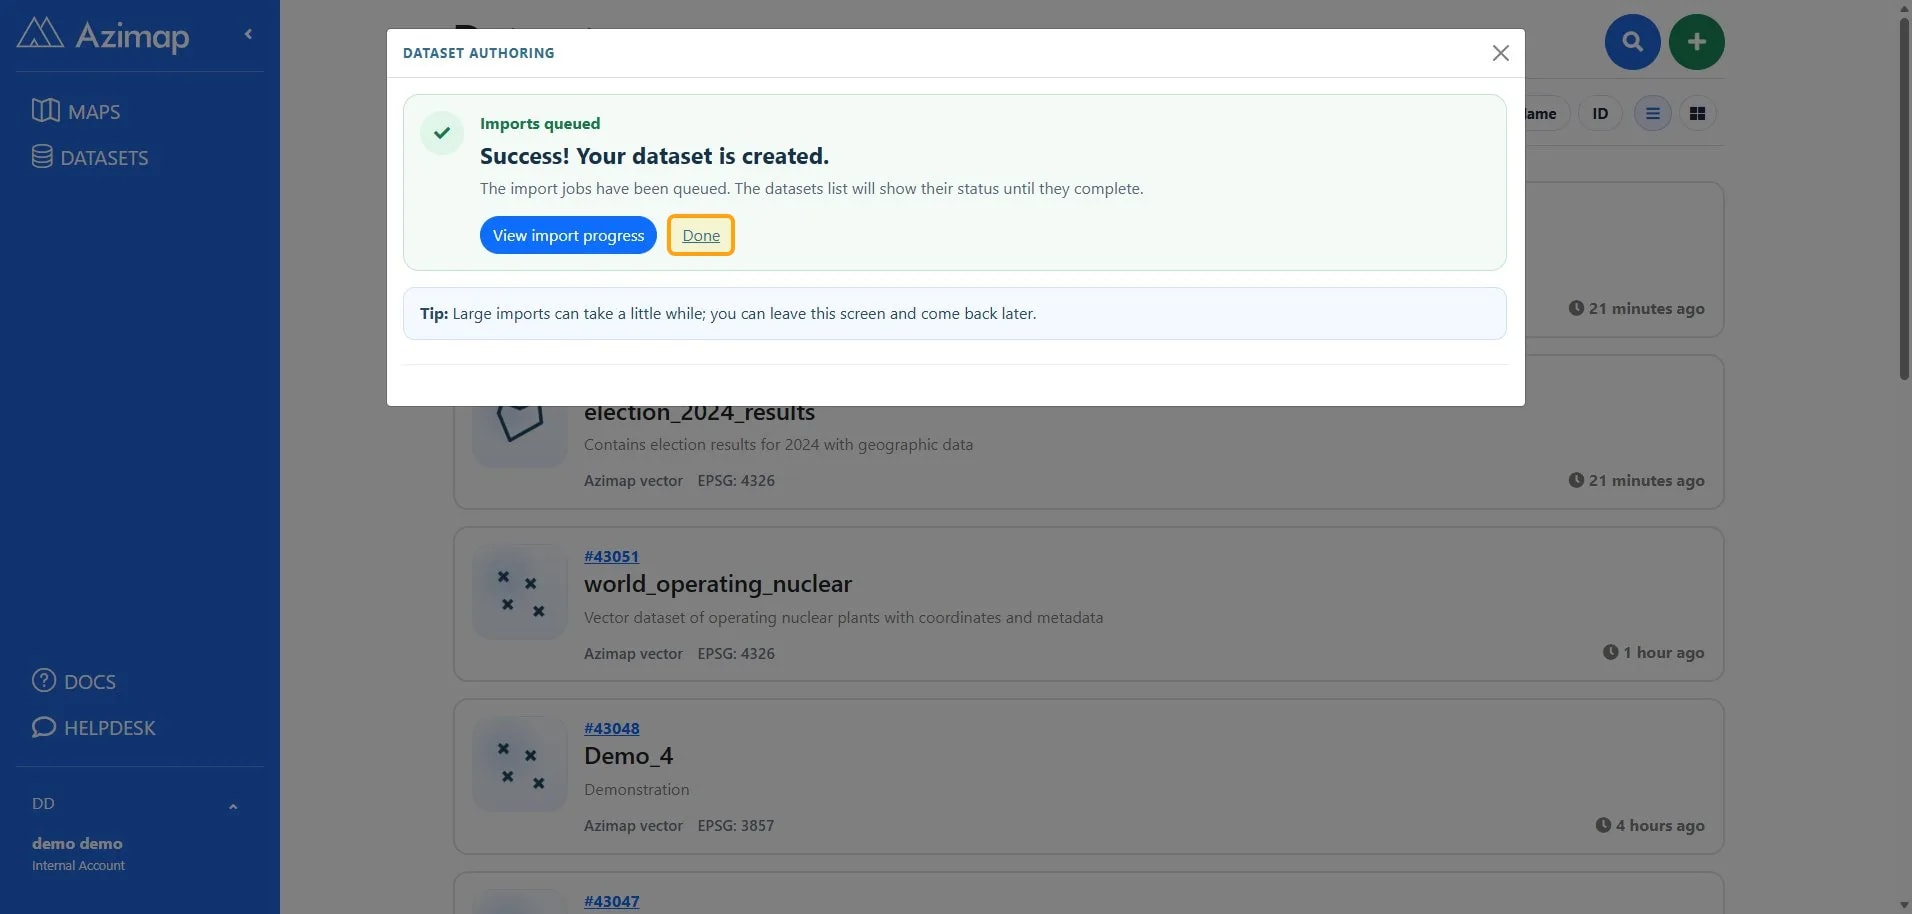
When the success message appears, select Done. Large
datasets may continue processing in the background.
1.2: Create the map
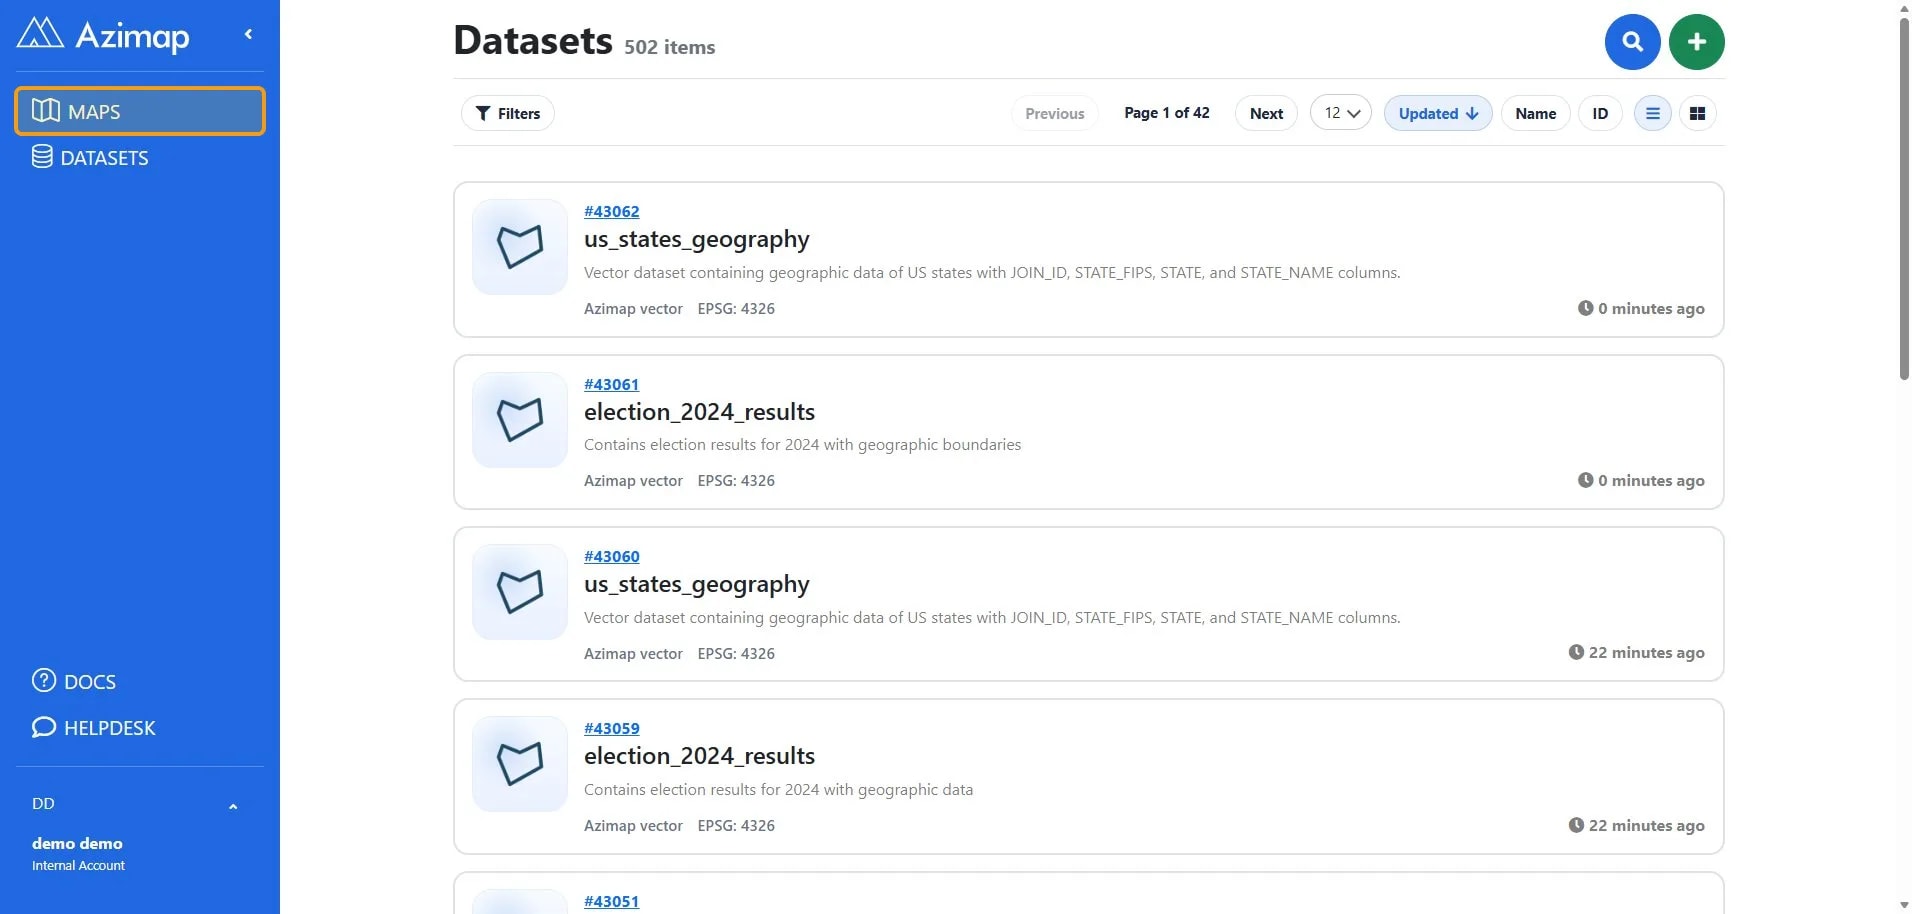
1.2.1 Open the map creation wizard
Select Maps in the left navigation.
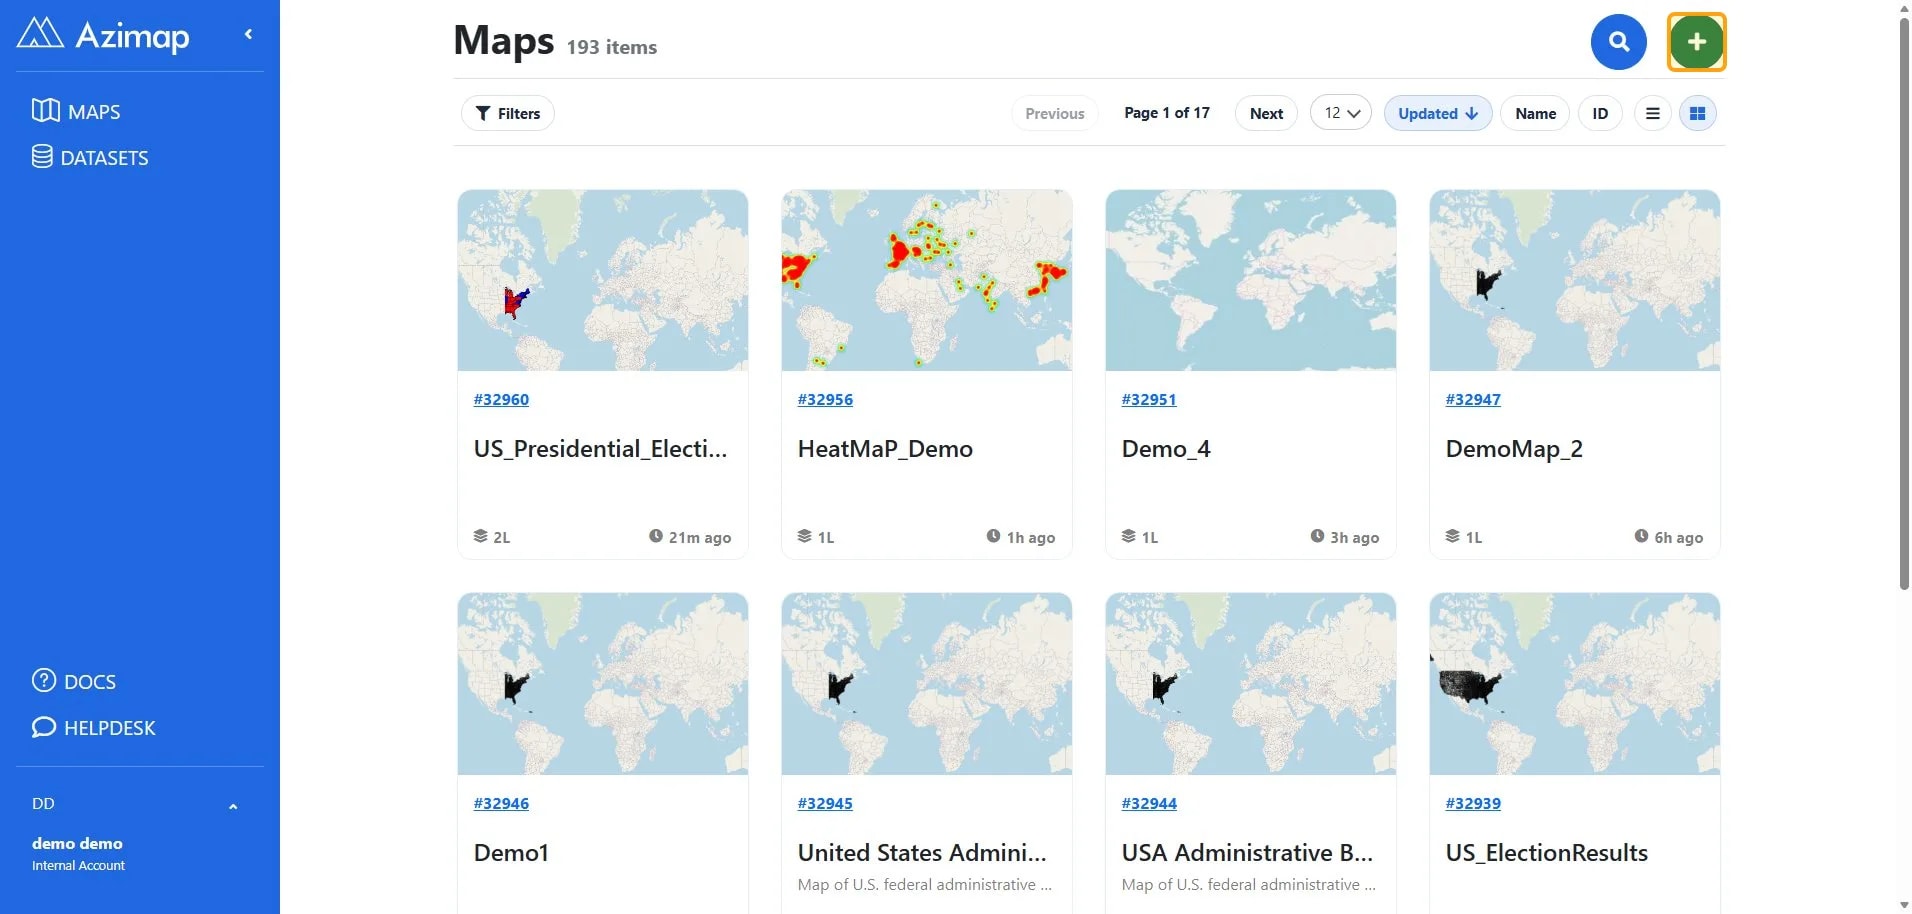
Select Create map.
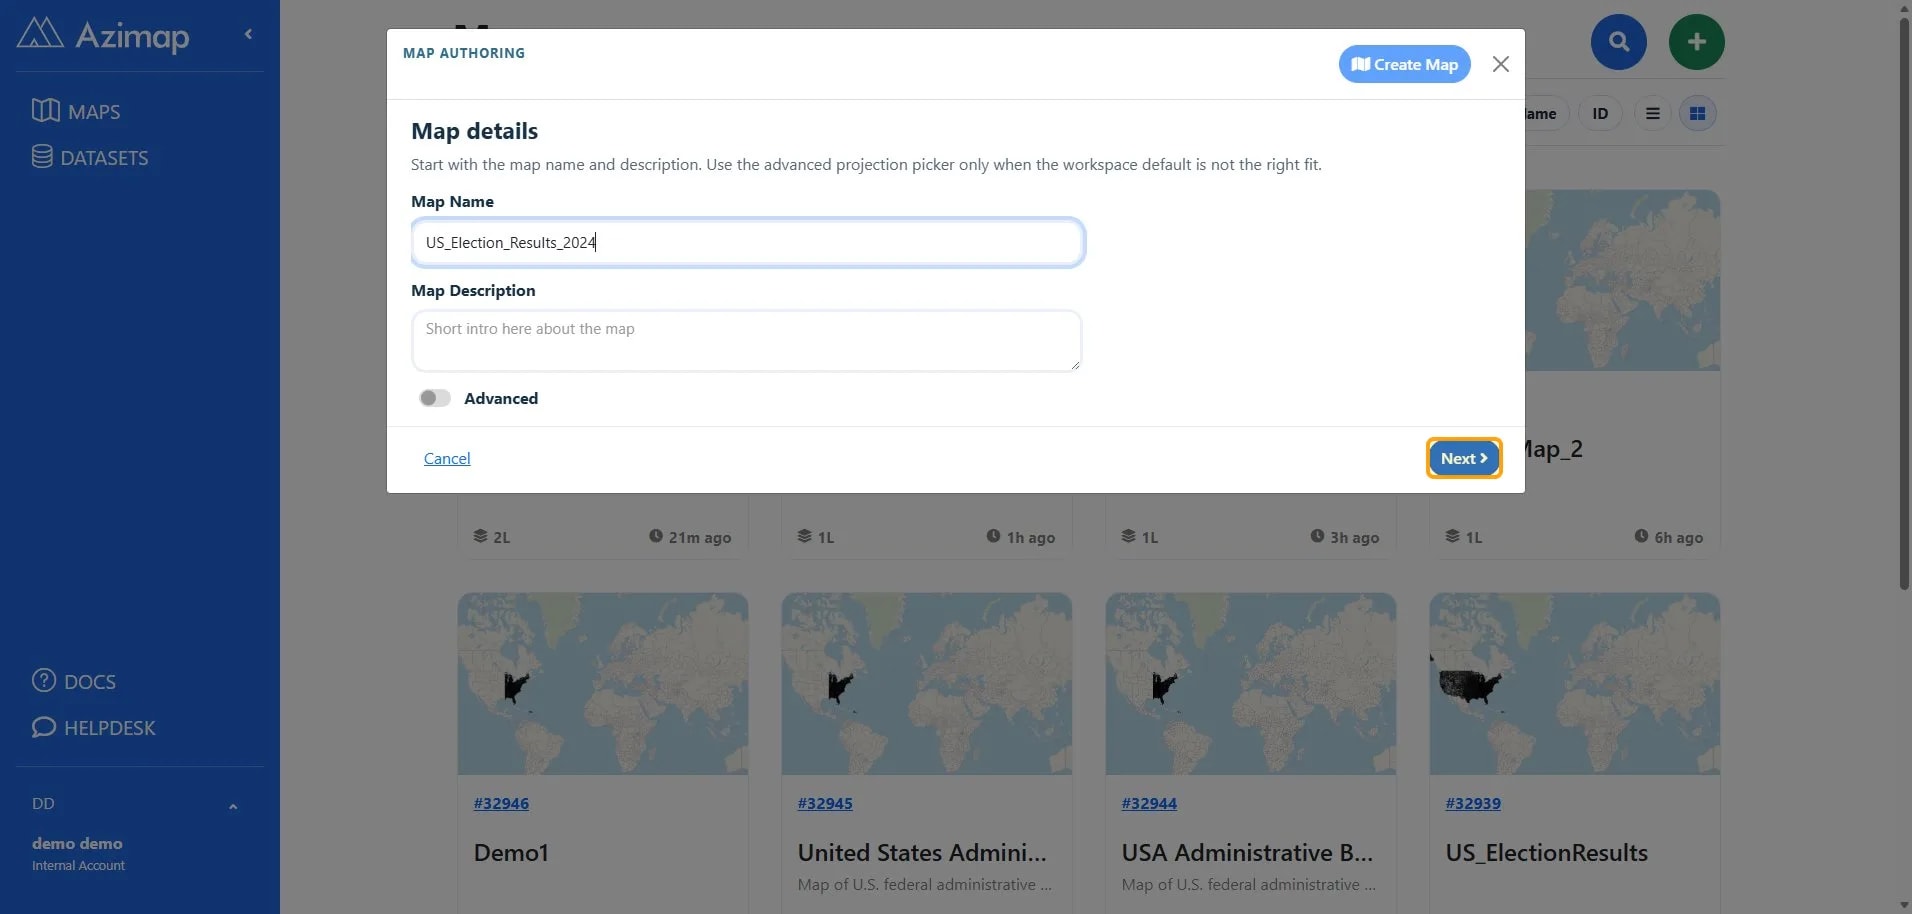
1.2.2 Enter the map details
Enter a map name, such as US Election Results 2024, and
optionally add a description.
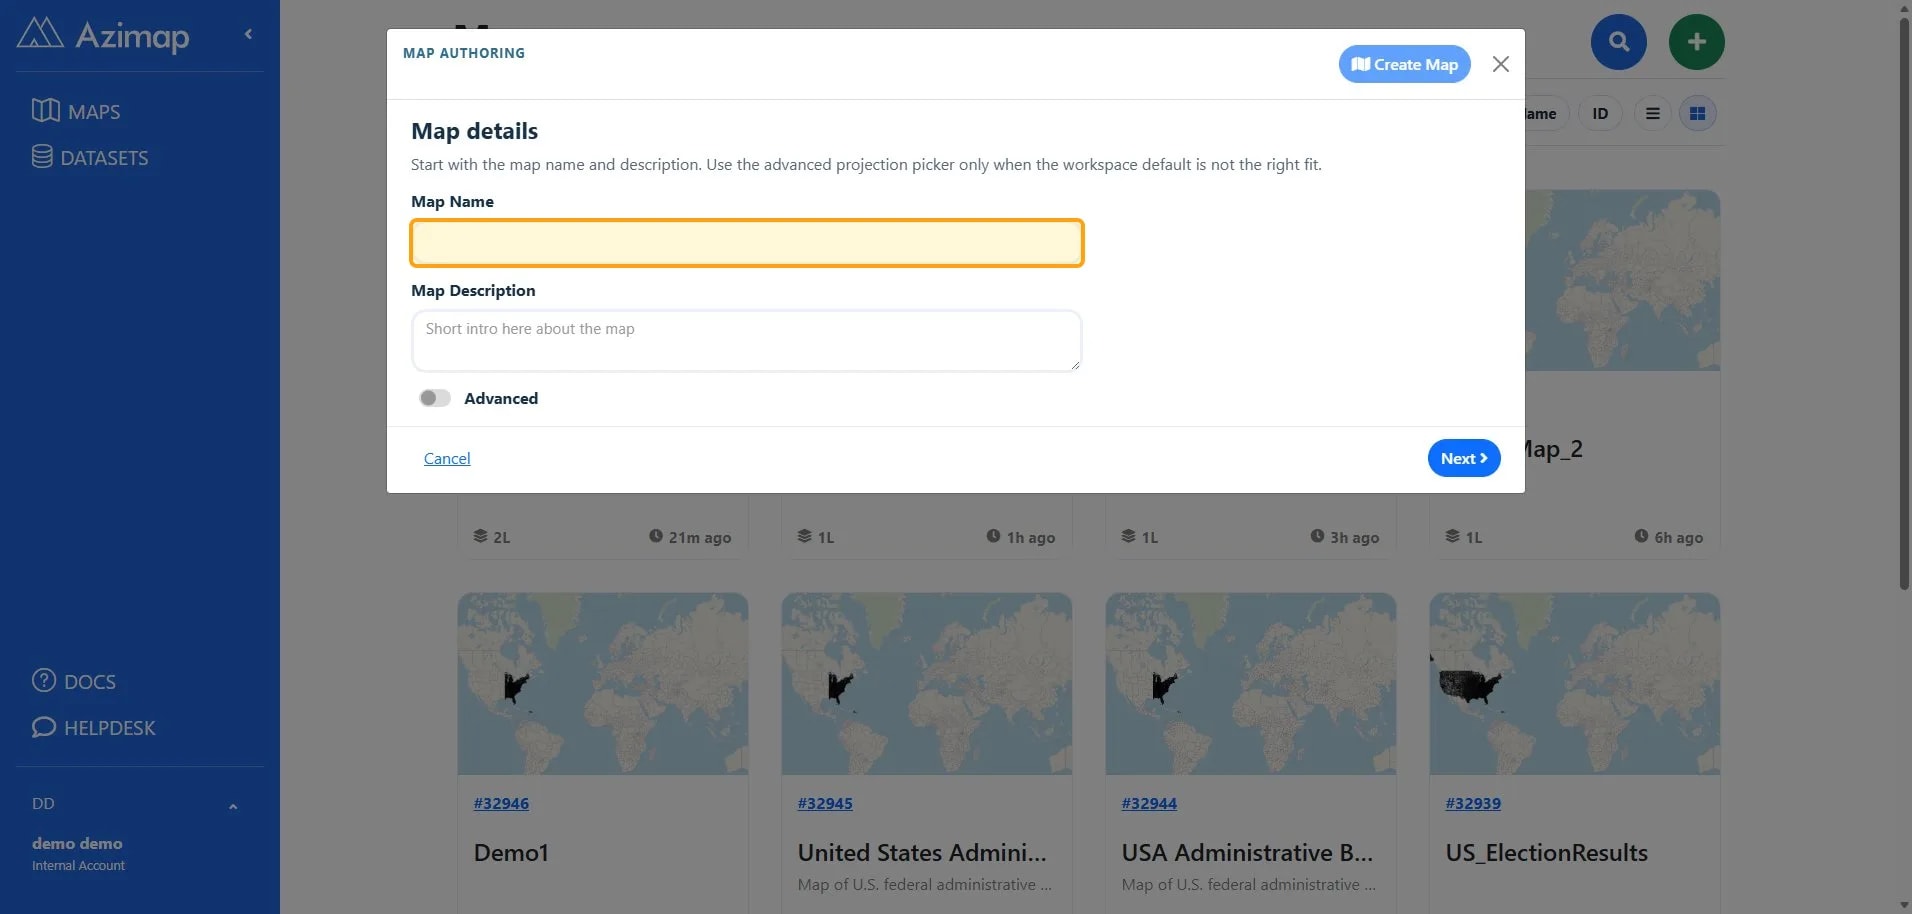
Select Next.
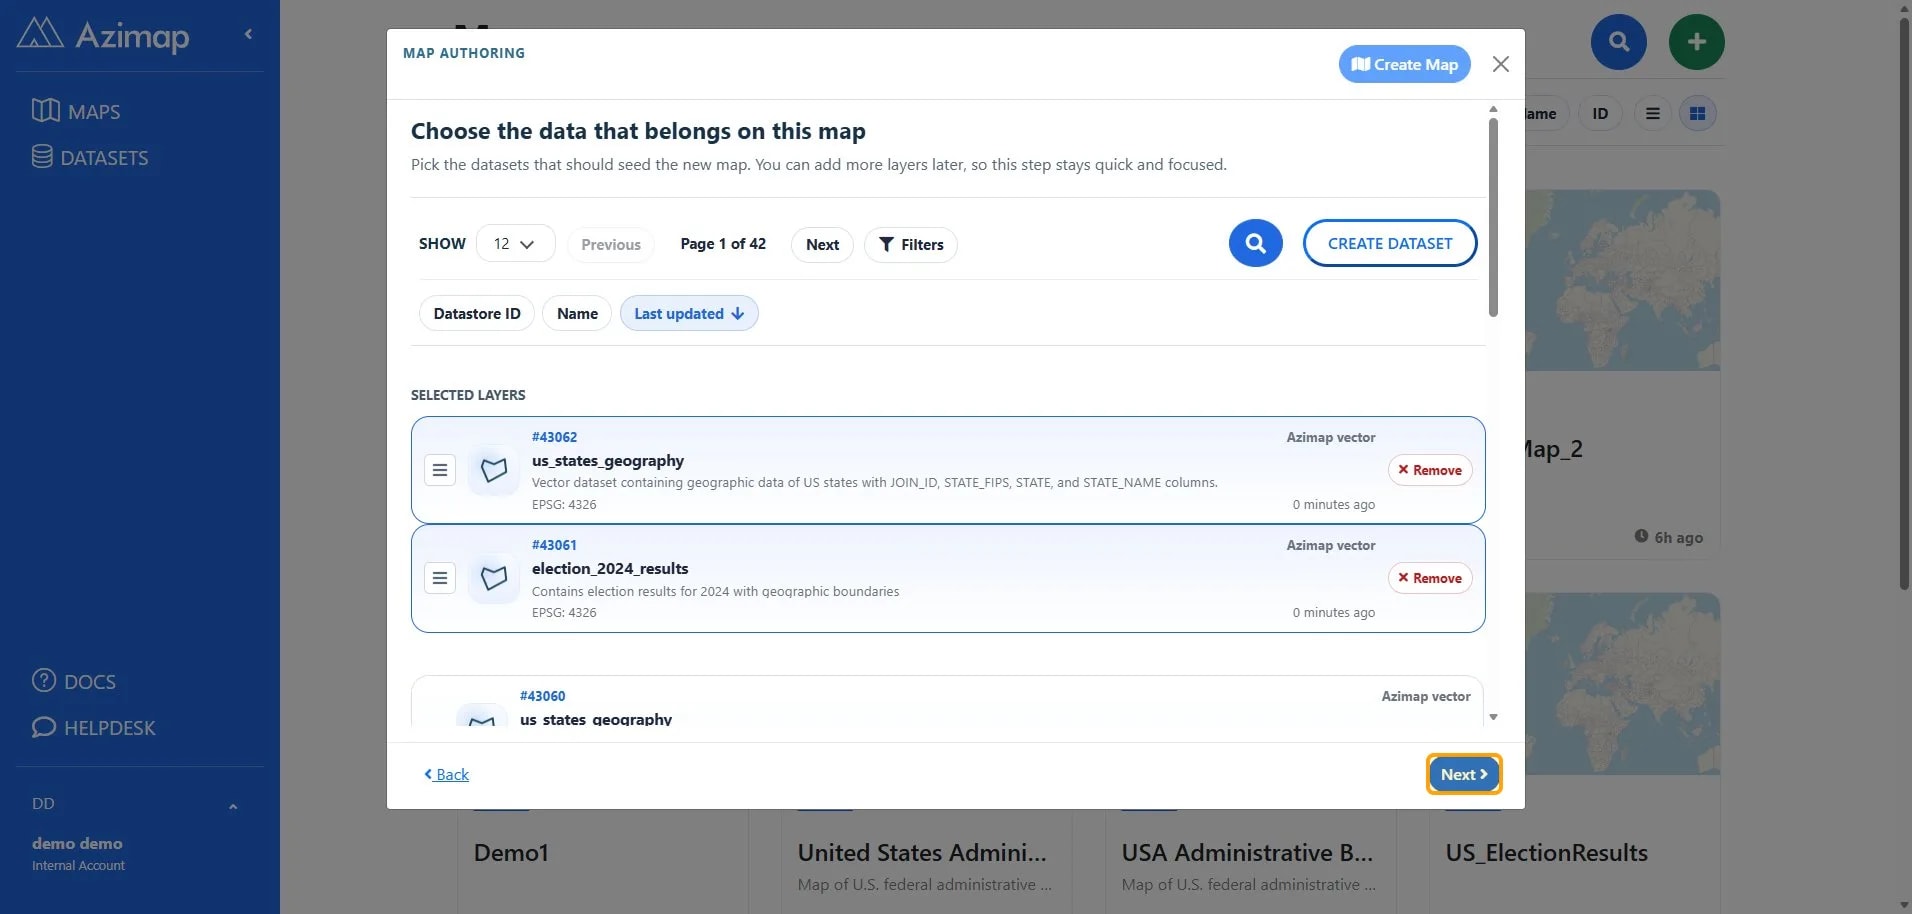
1.2.3 Add the datasets
In the Datasets step, select both us_states_geography and
election_2024_results.
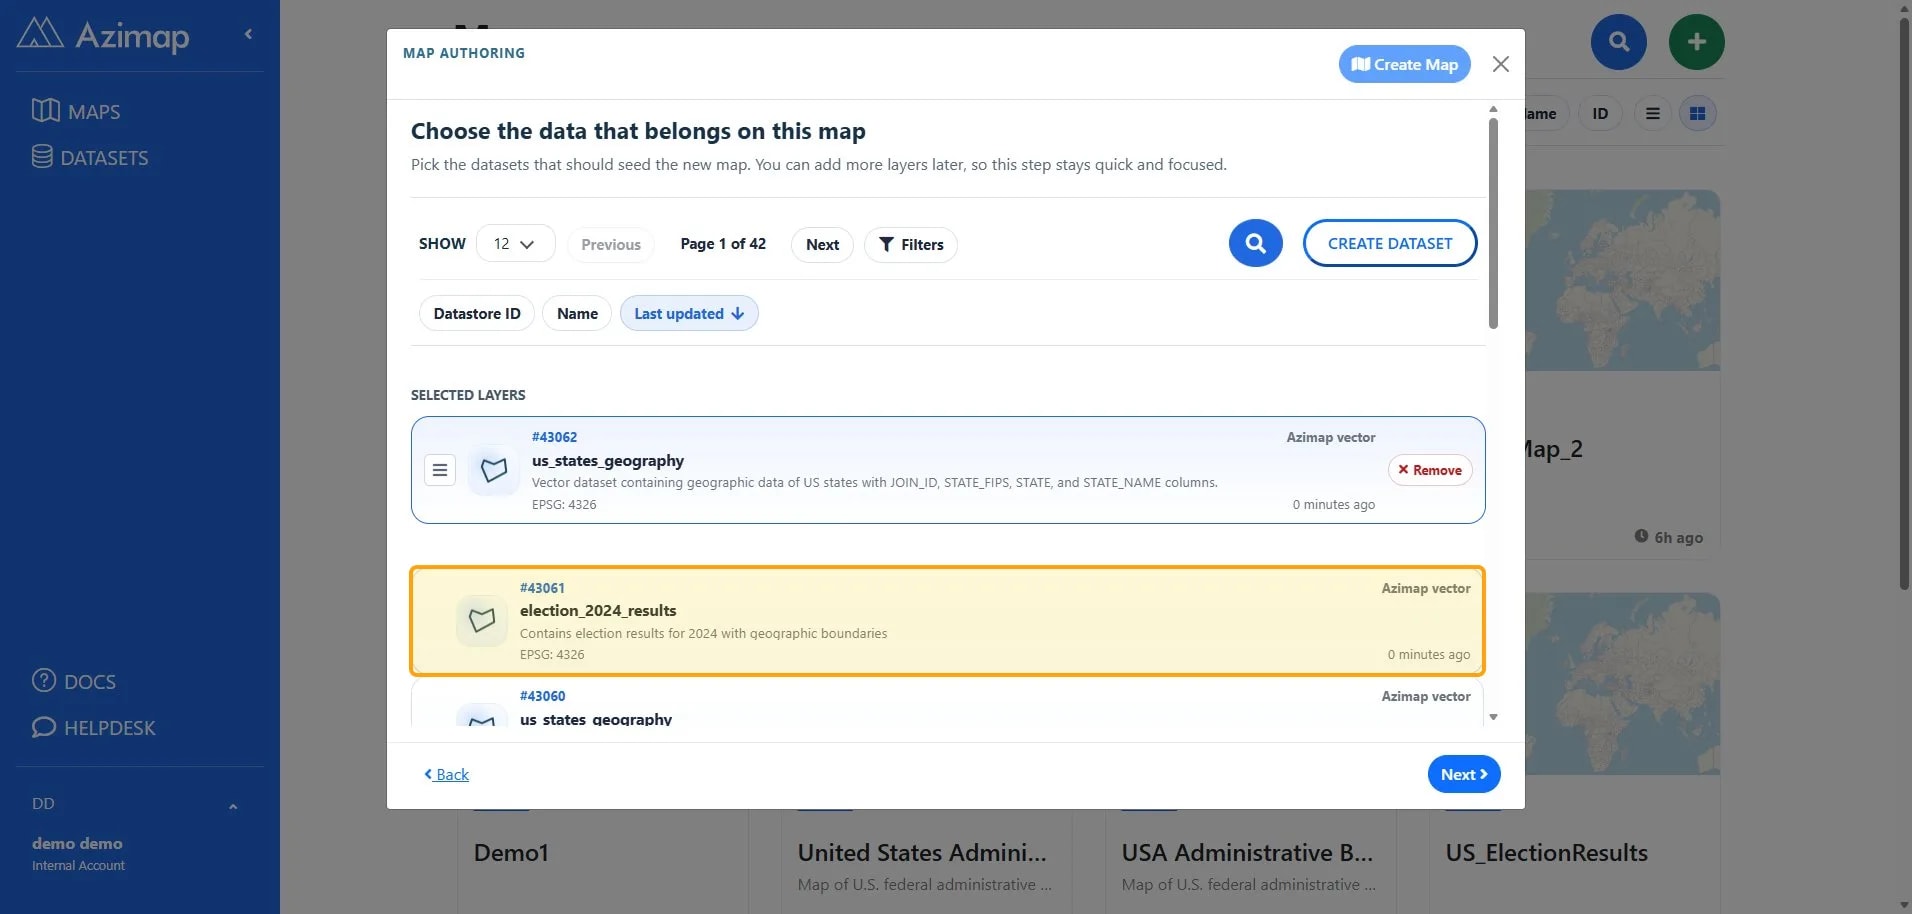
Select Next.
1.2.4 Enable analysis and create the map
Under optional modules, select Analysis. Leave the default
basemap selected.
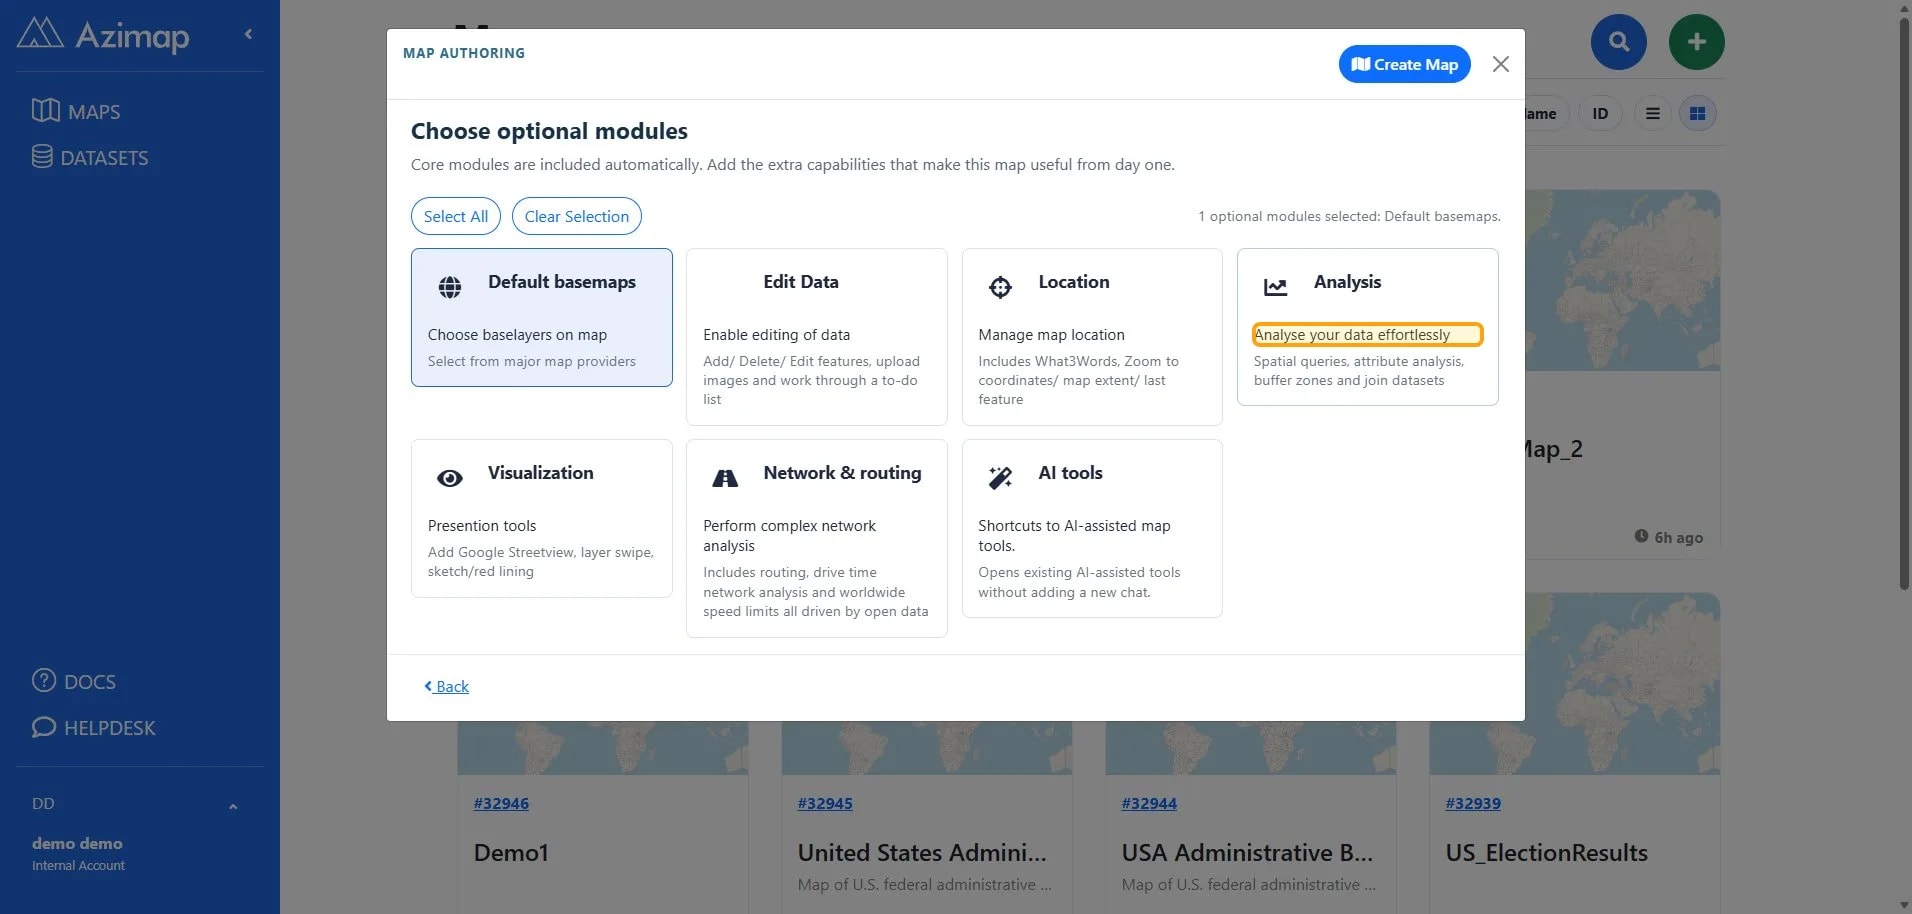
Select Create Map and wait for the map to load and enable "Edit Data" and "Analysis".
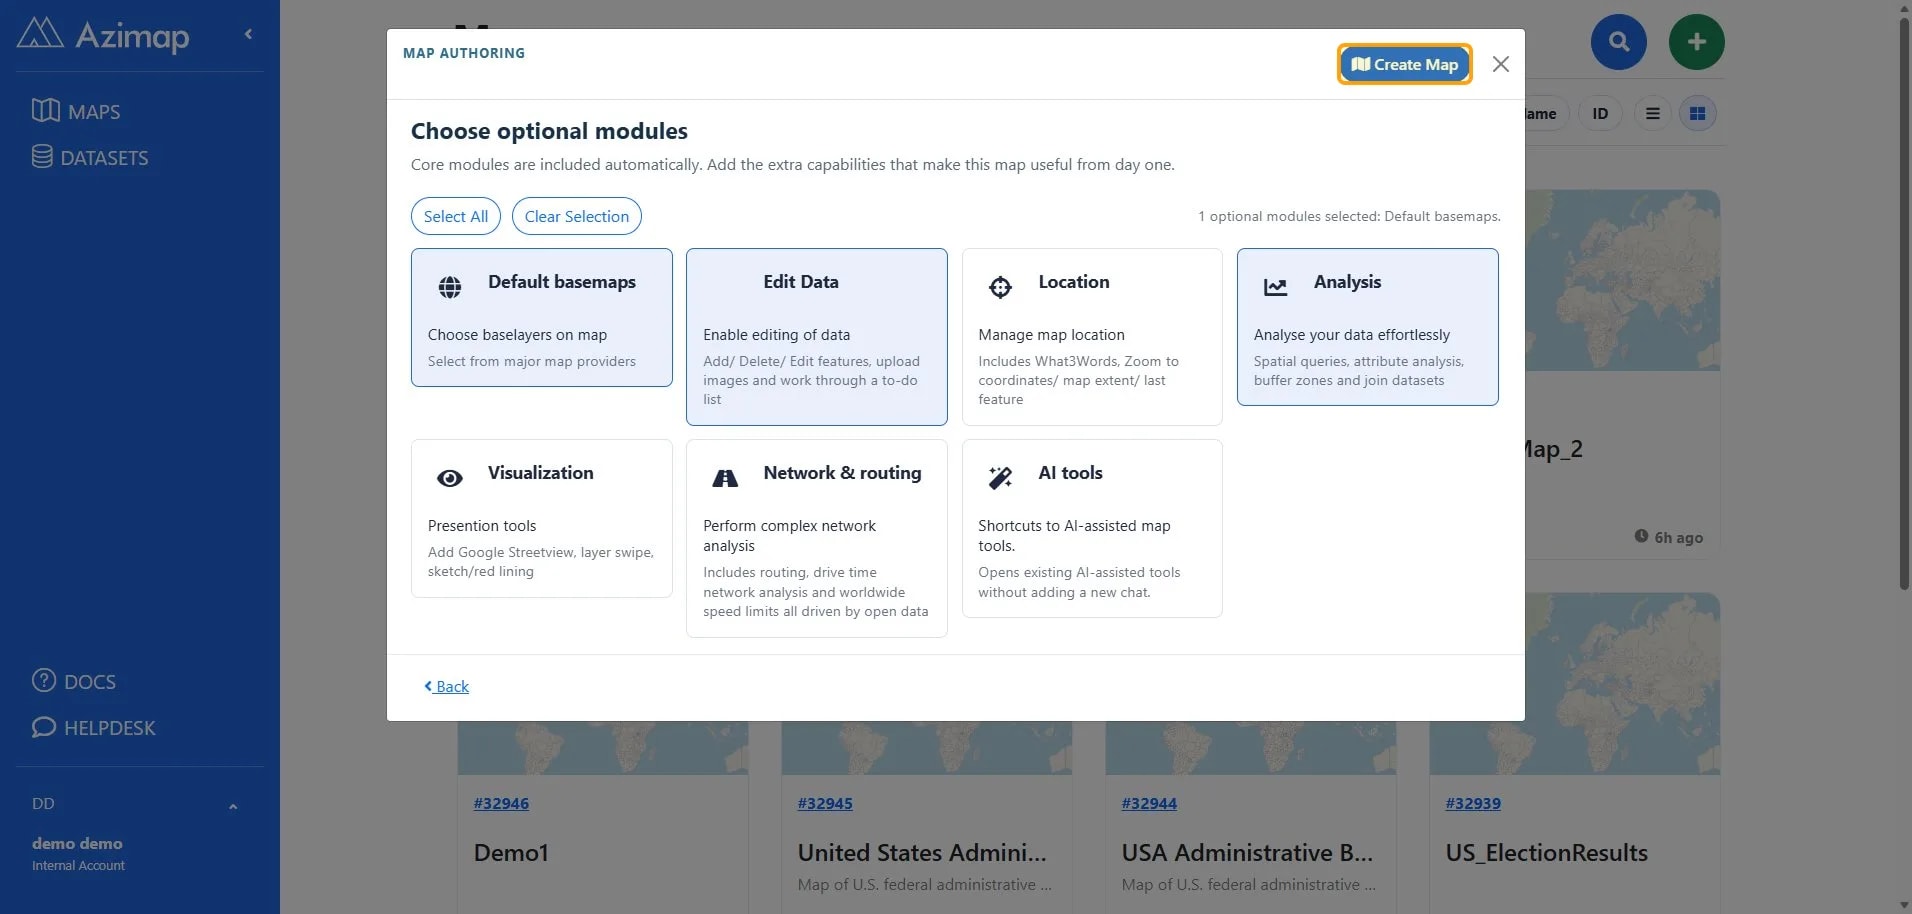
2. Join your data together -Using the 'Join Data' tool
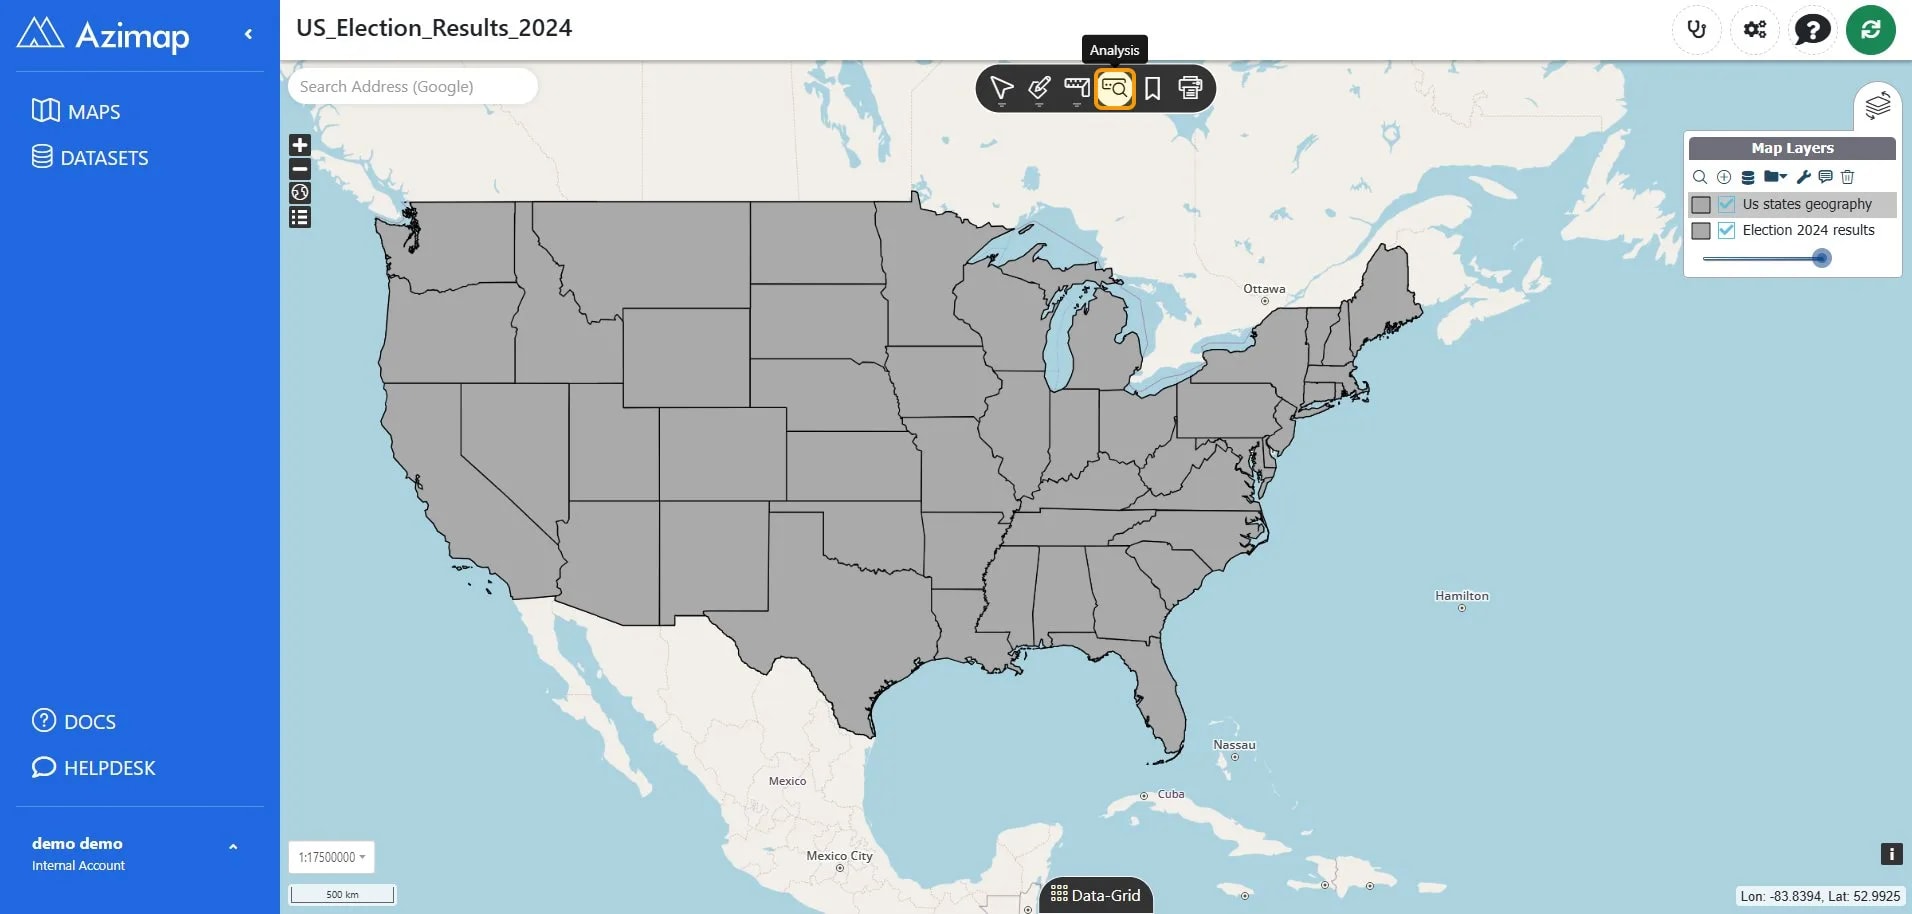
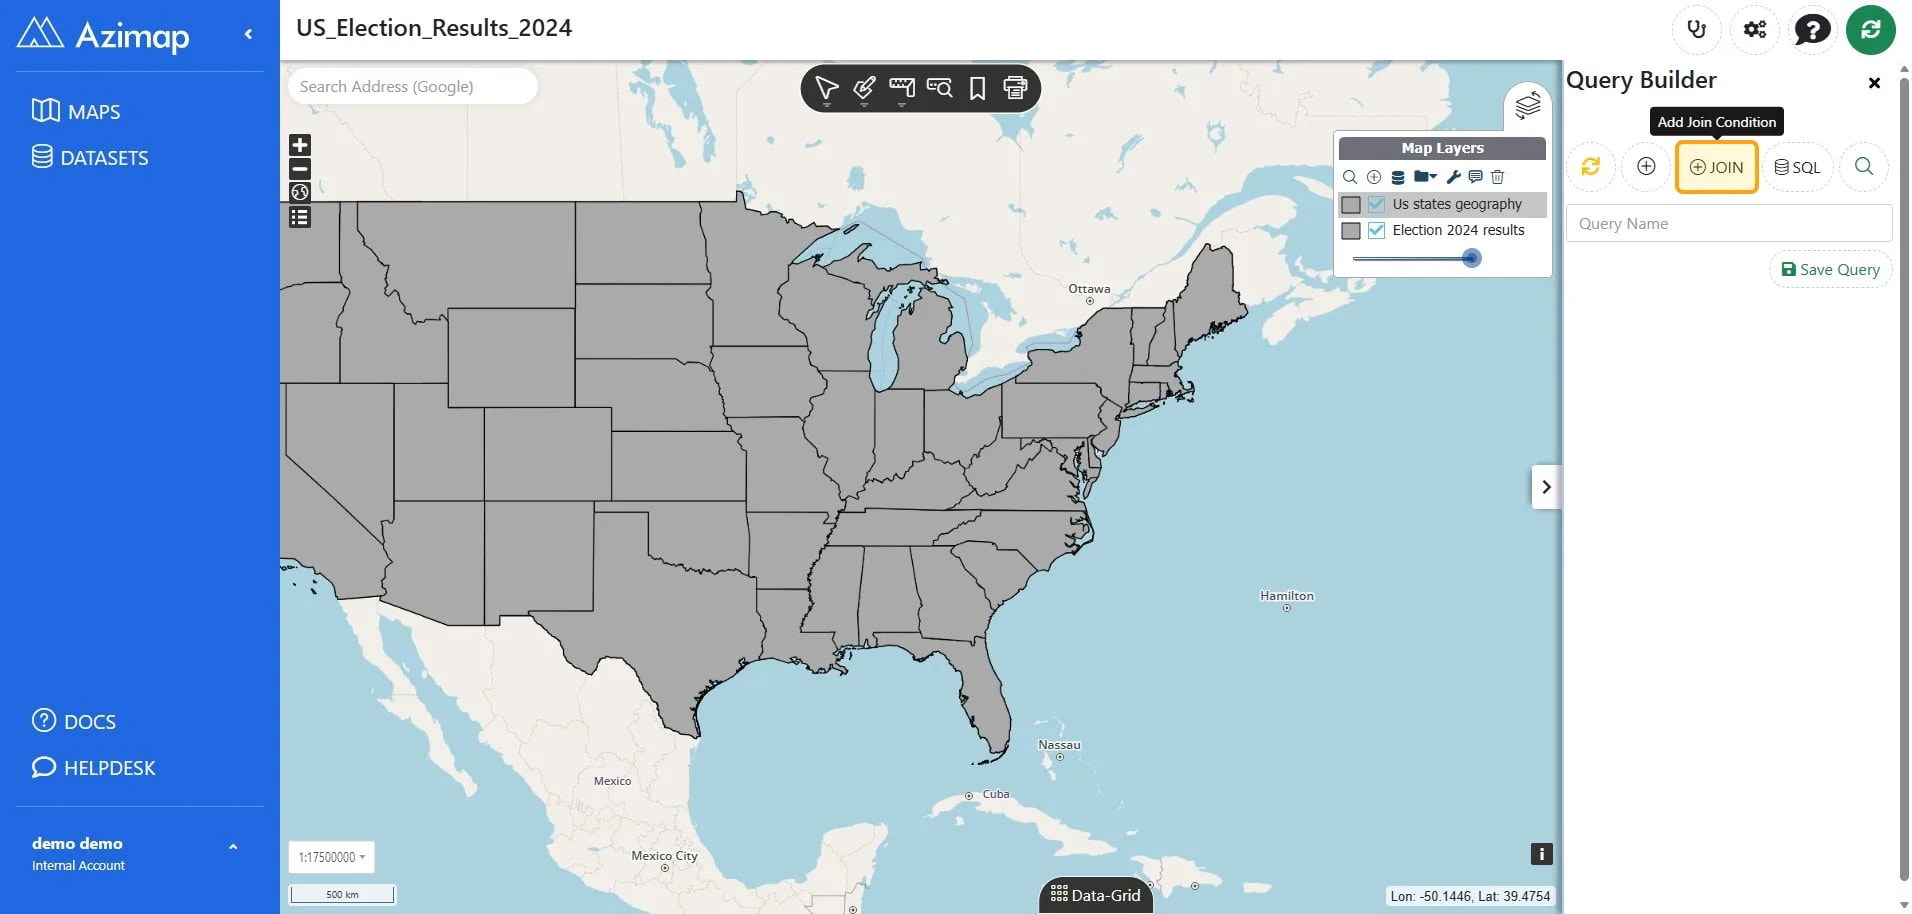
2.1 Open the Query Builder
Select Analysis in the top toolbar.
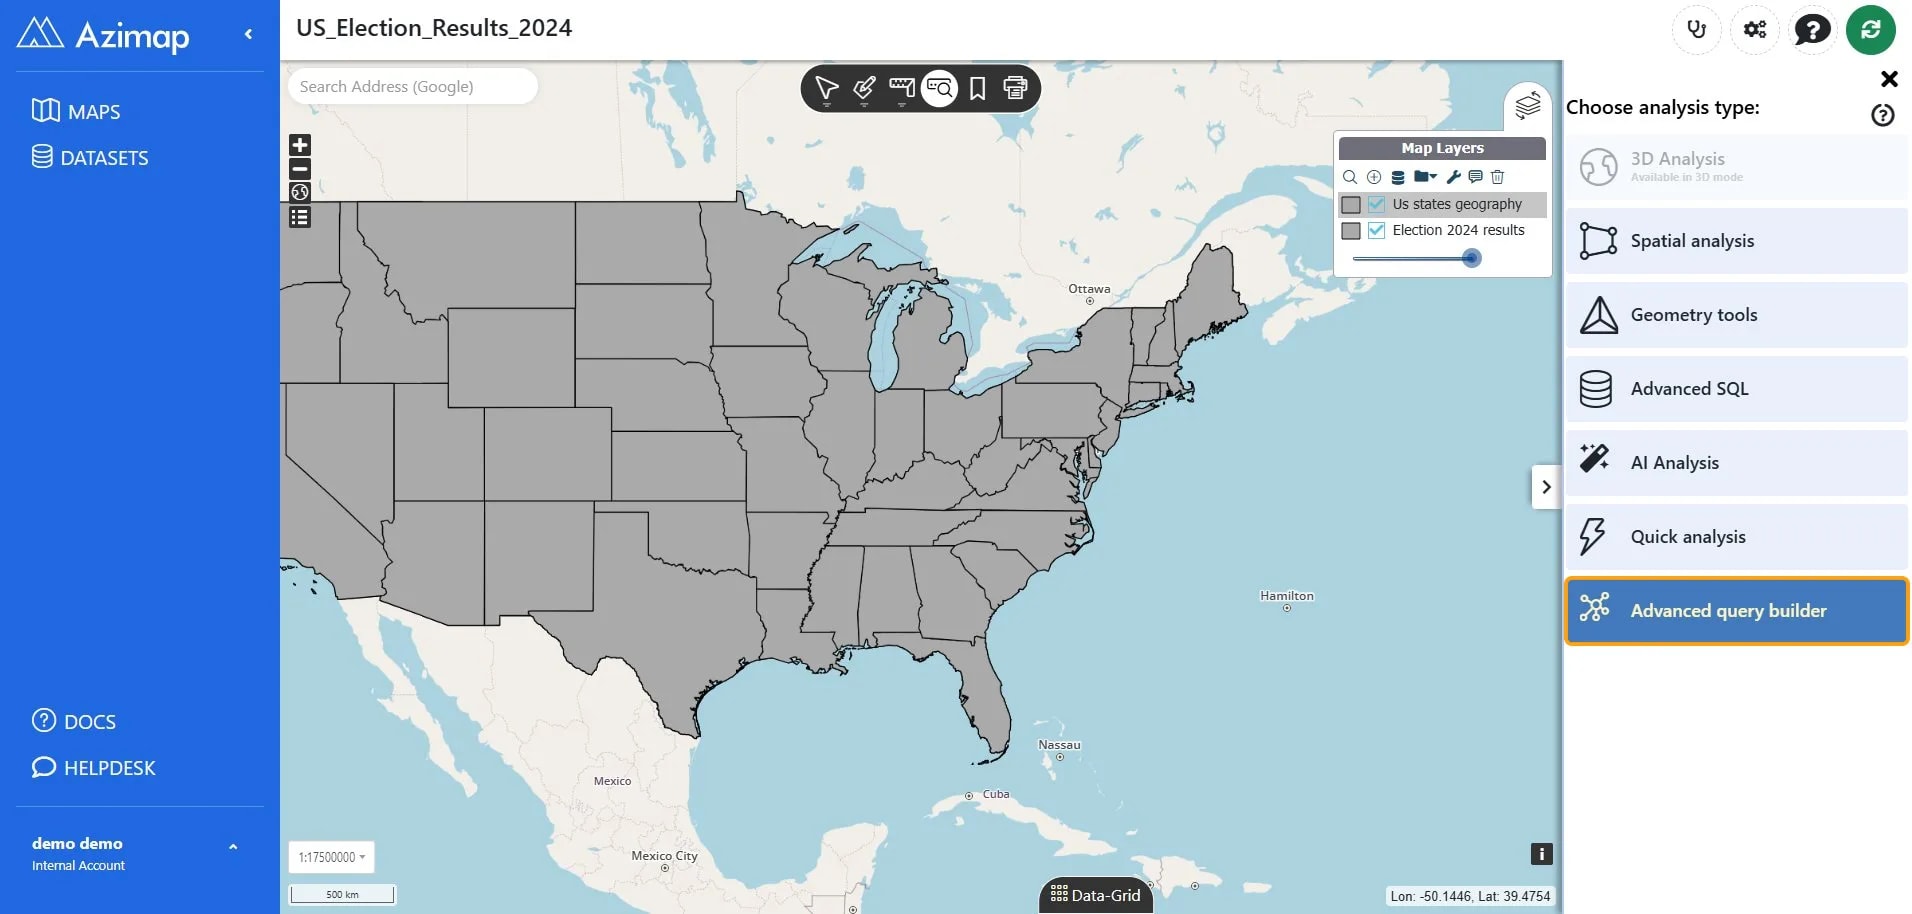
Select Advanced query builder.
Select JOIN.
2.2. Configure the datasets and matching fields
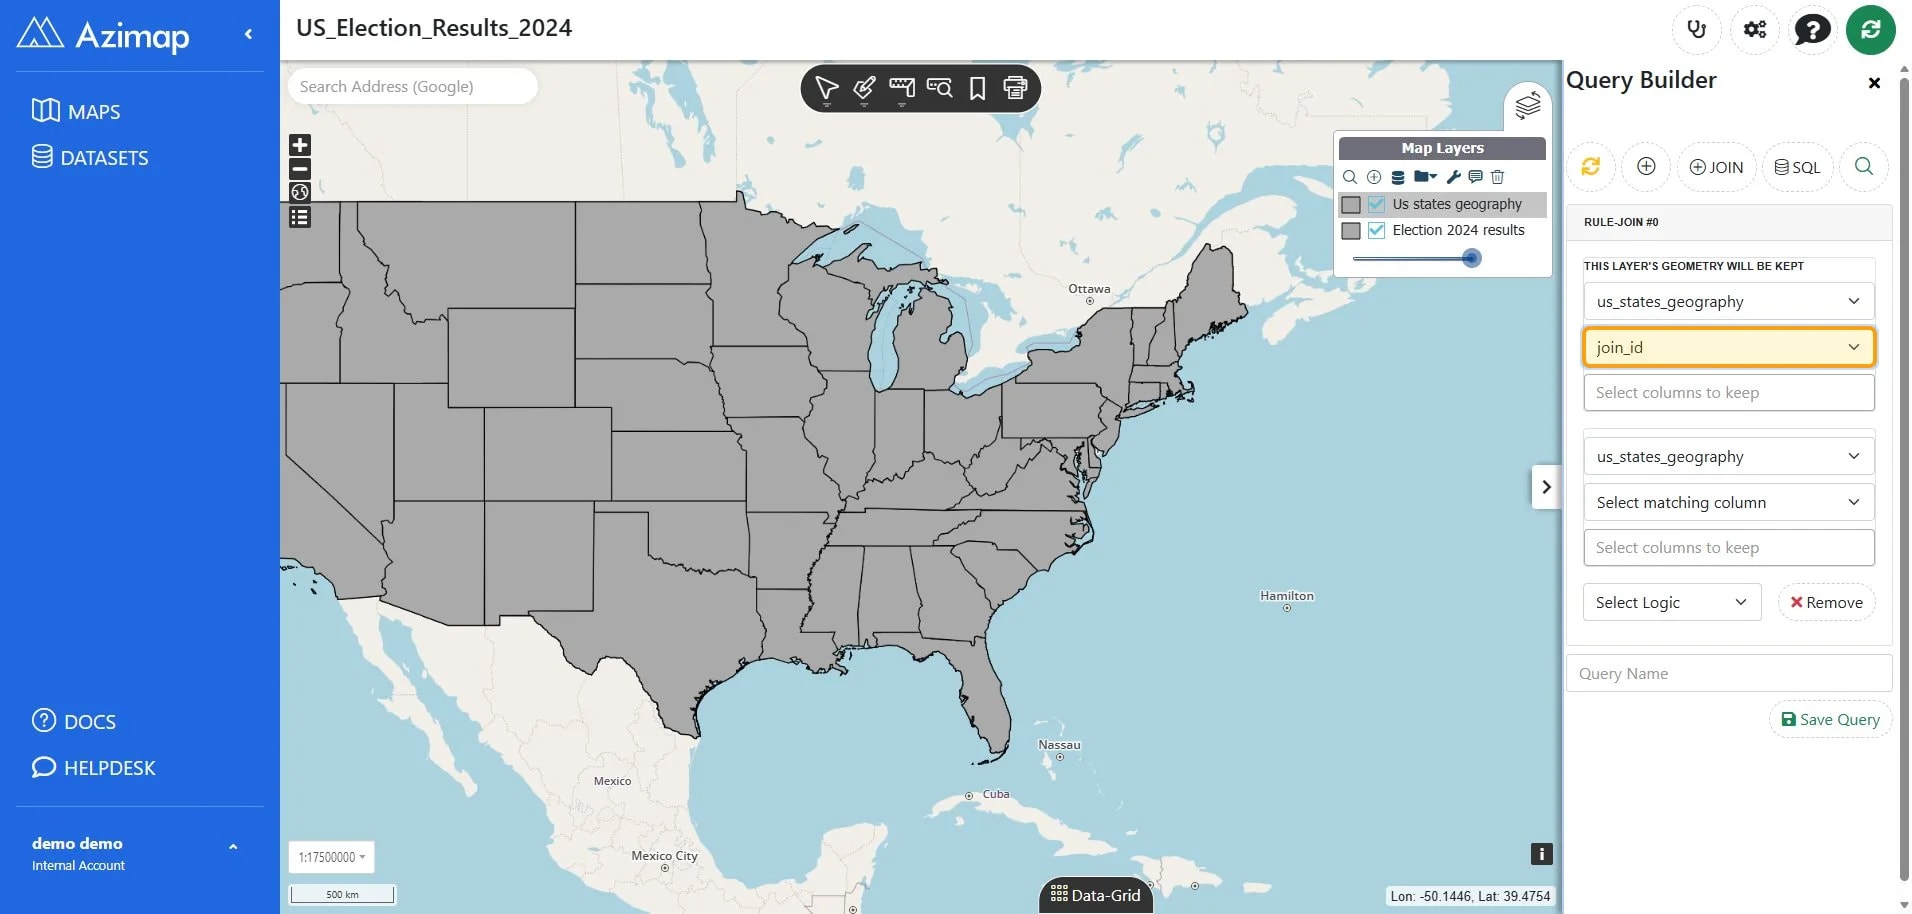
For This layer's geometry will be kept, choose
us_states_geography. Set its matching column to join_id.
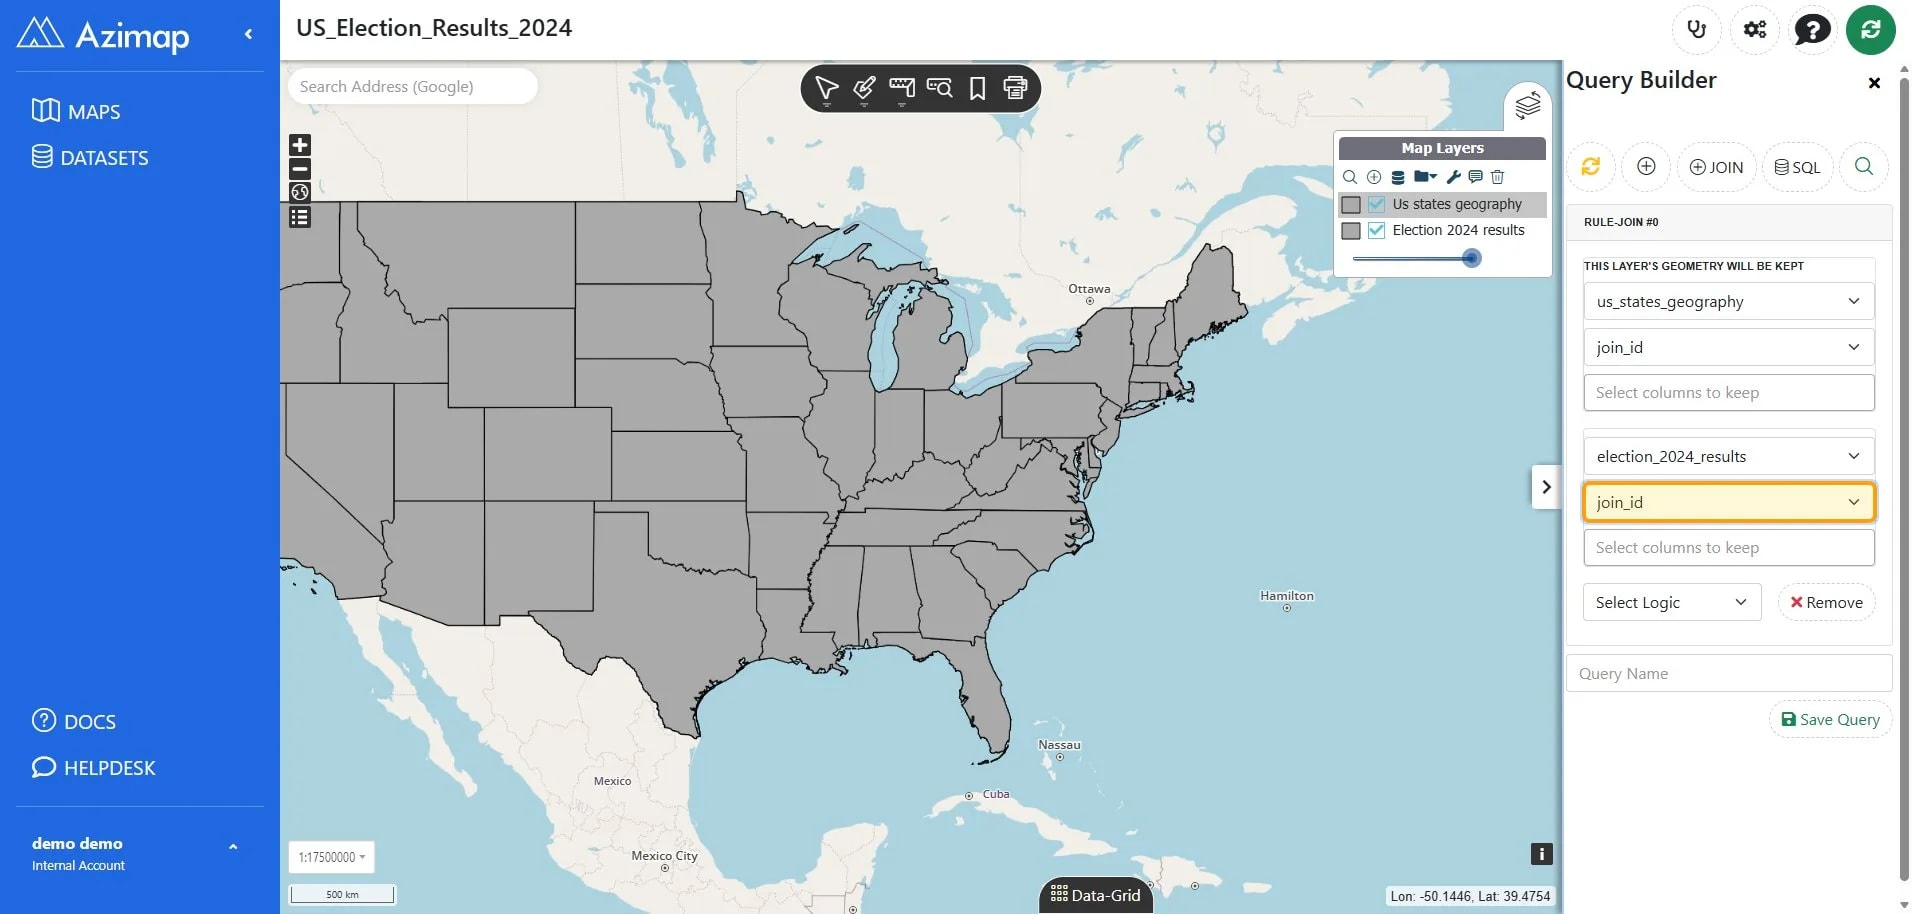
For the second dataset, choose election_2024_results. Set its matching column to join_id.
2.3. Choose the join type
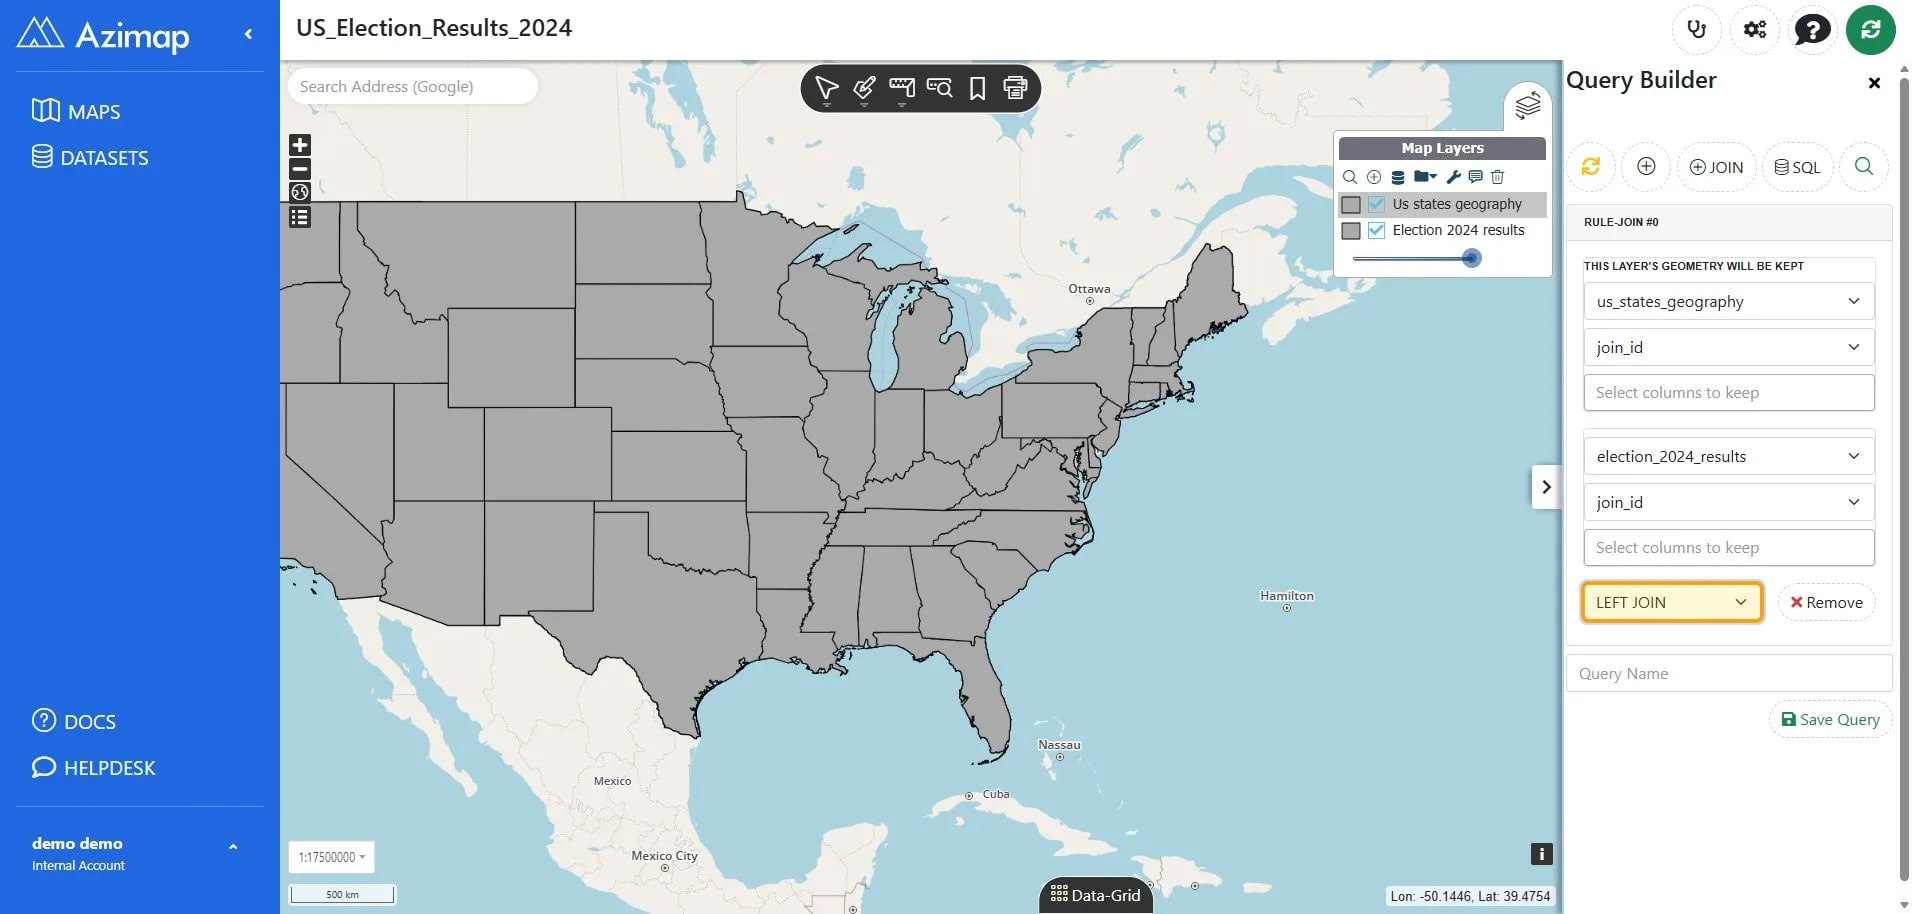
Set Select Logic to LEFT JOIN. This keeps every state
polygon and adds matching election data where the IDs agree.
2.4. Save and run the query
Enter a descriptive query name, such as US states with 2024
election results.
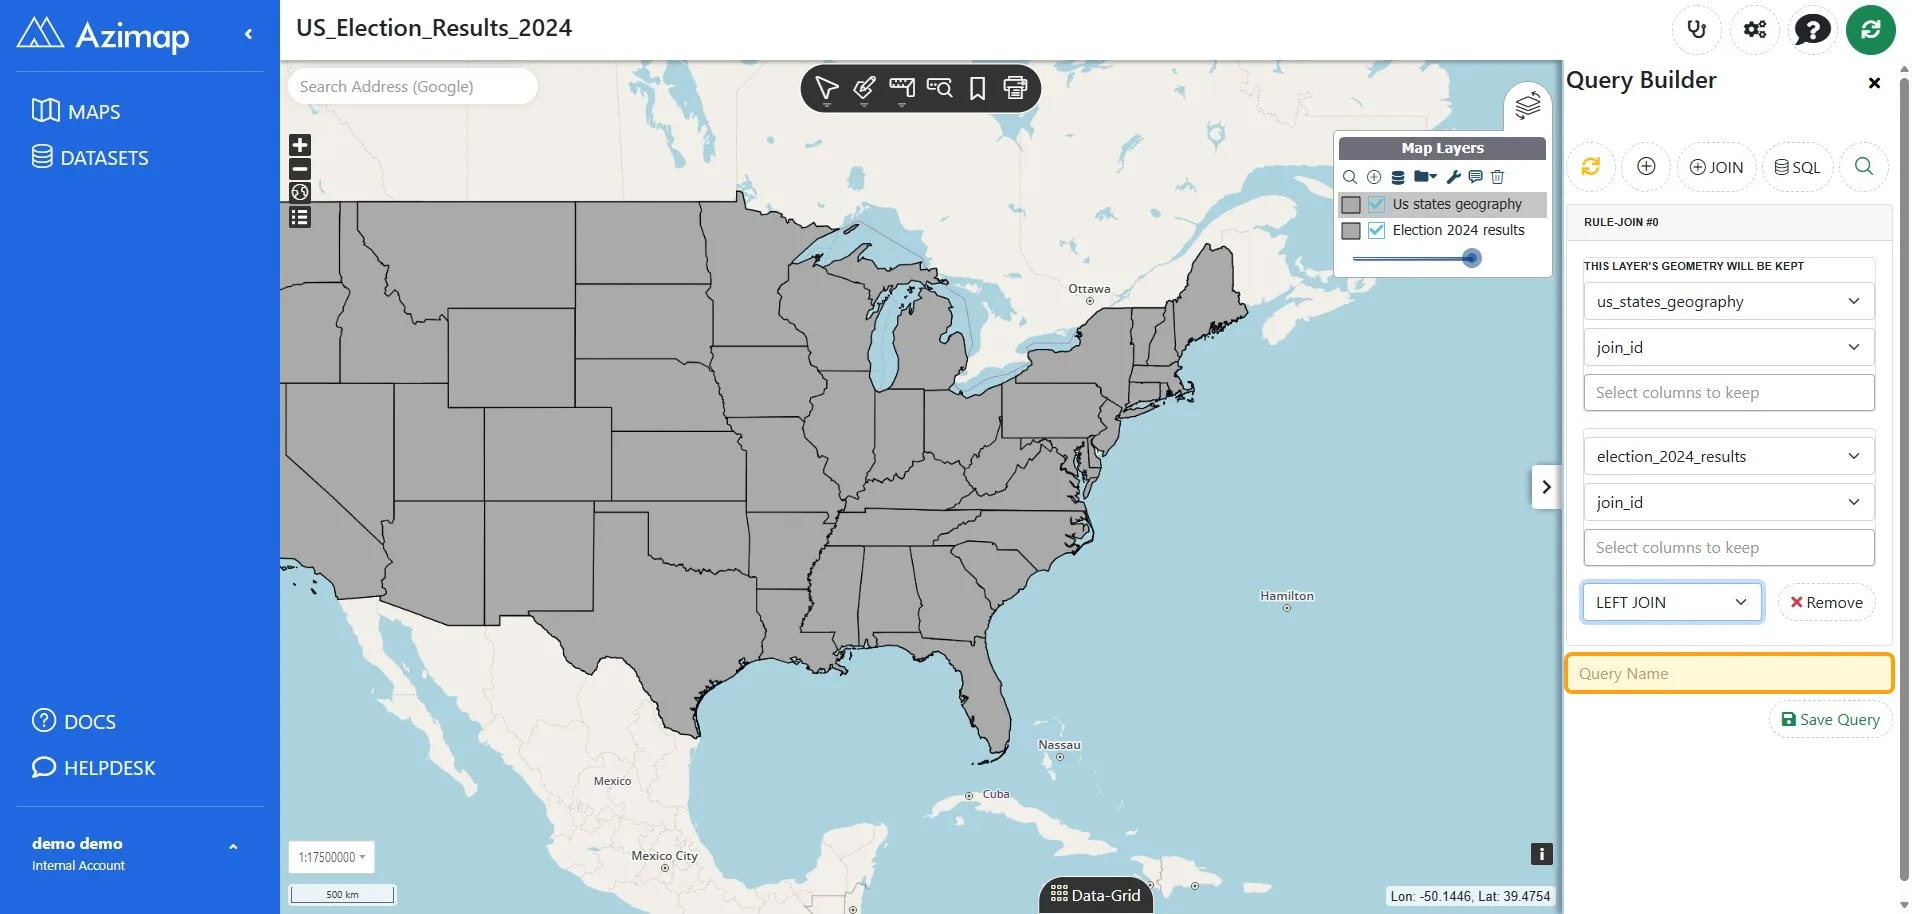
Select Save Query.
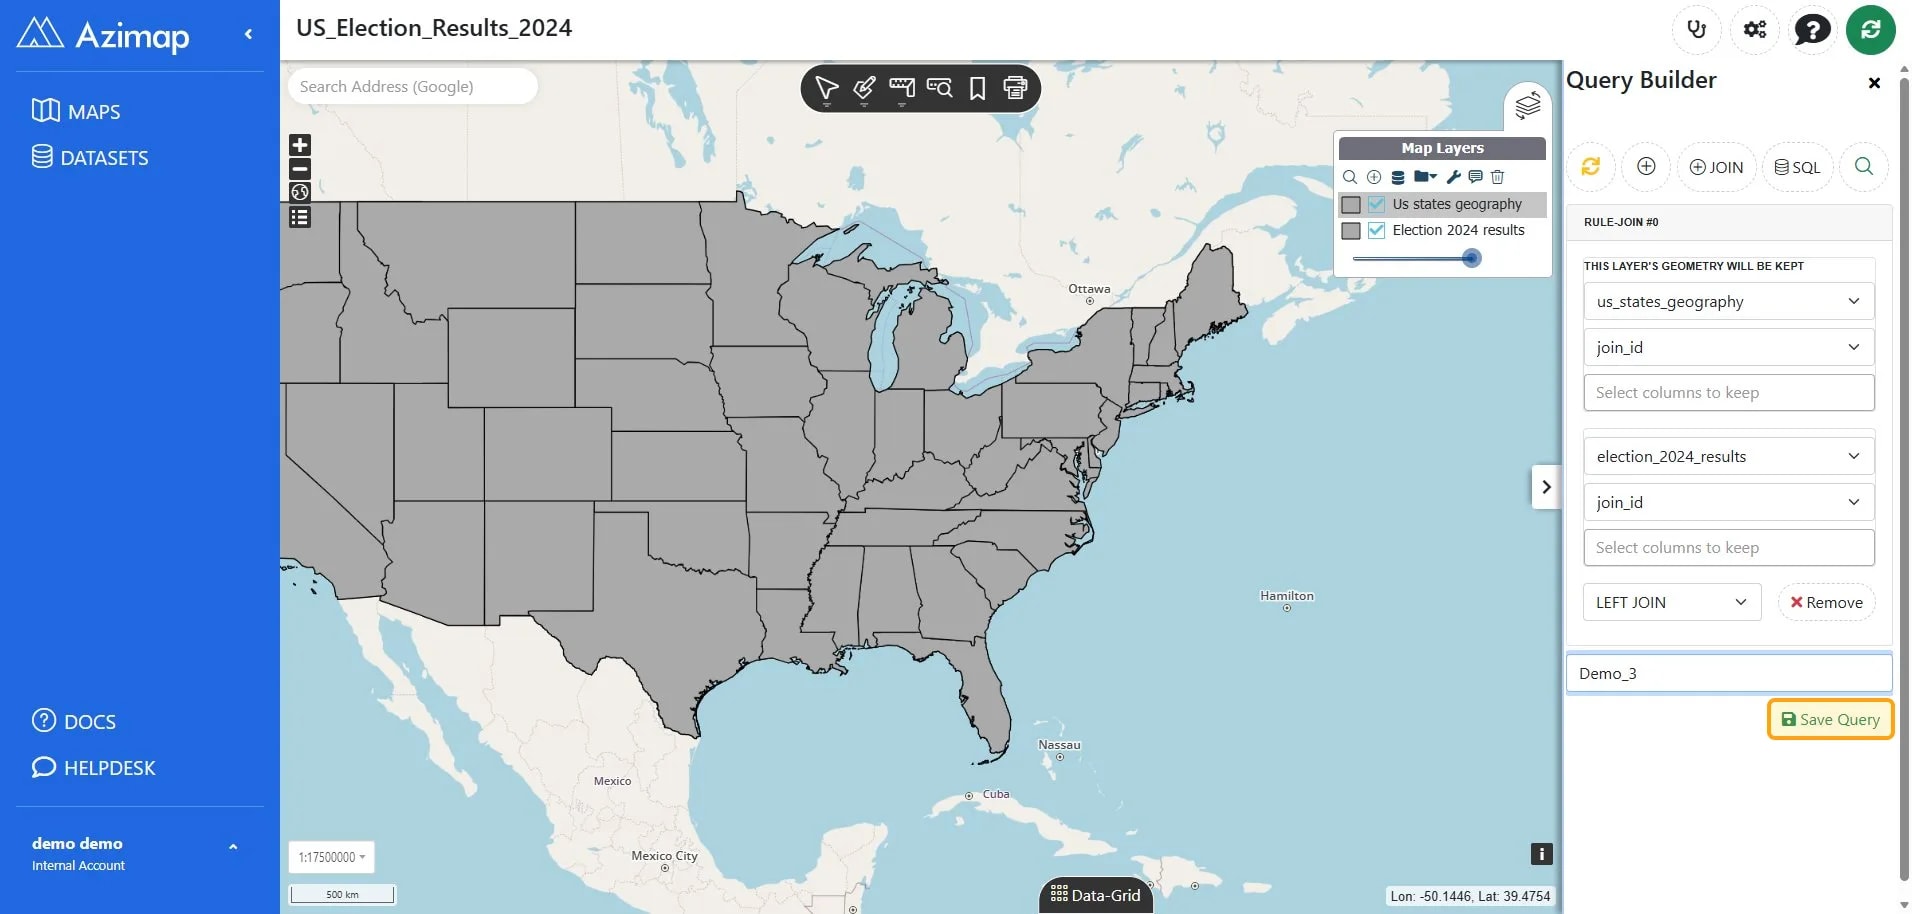
Select Submit query and wait for the map to refresh.
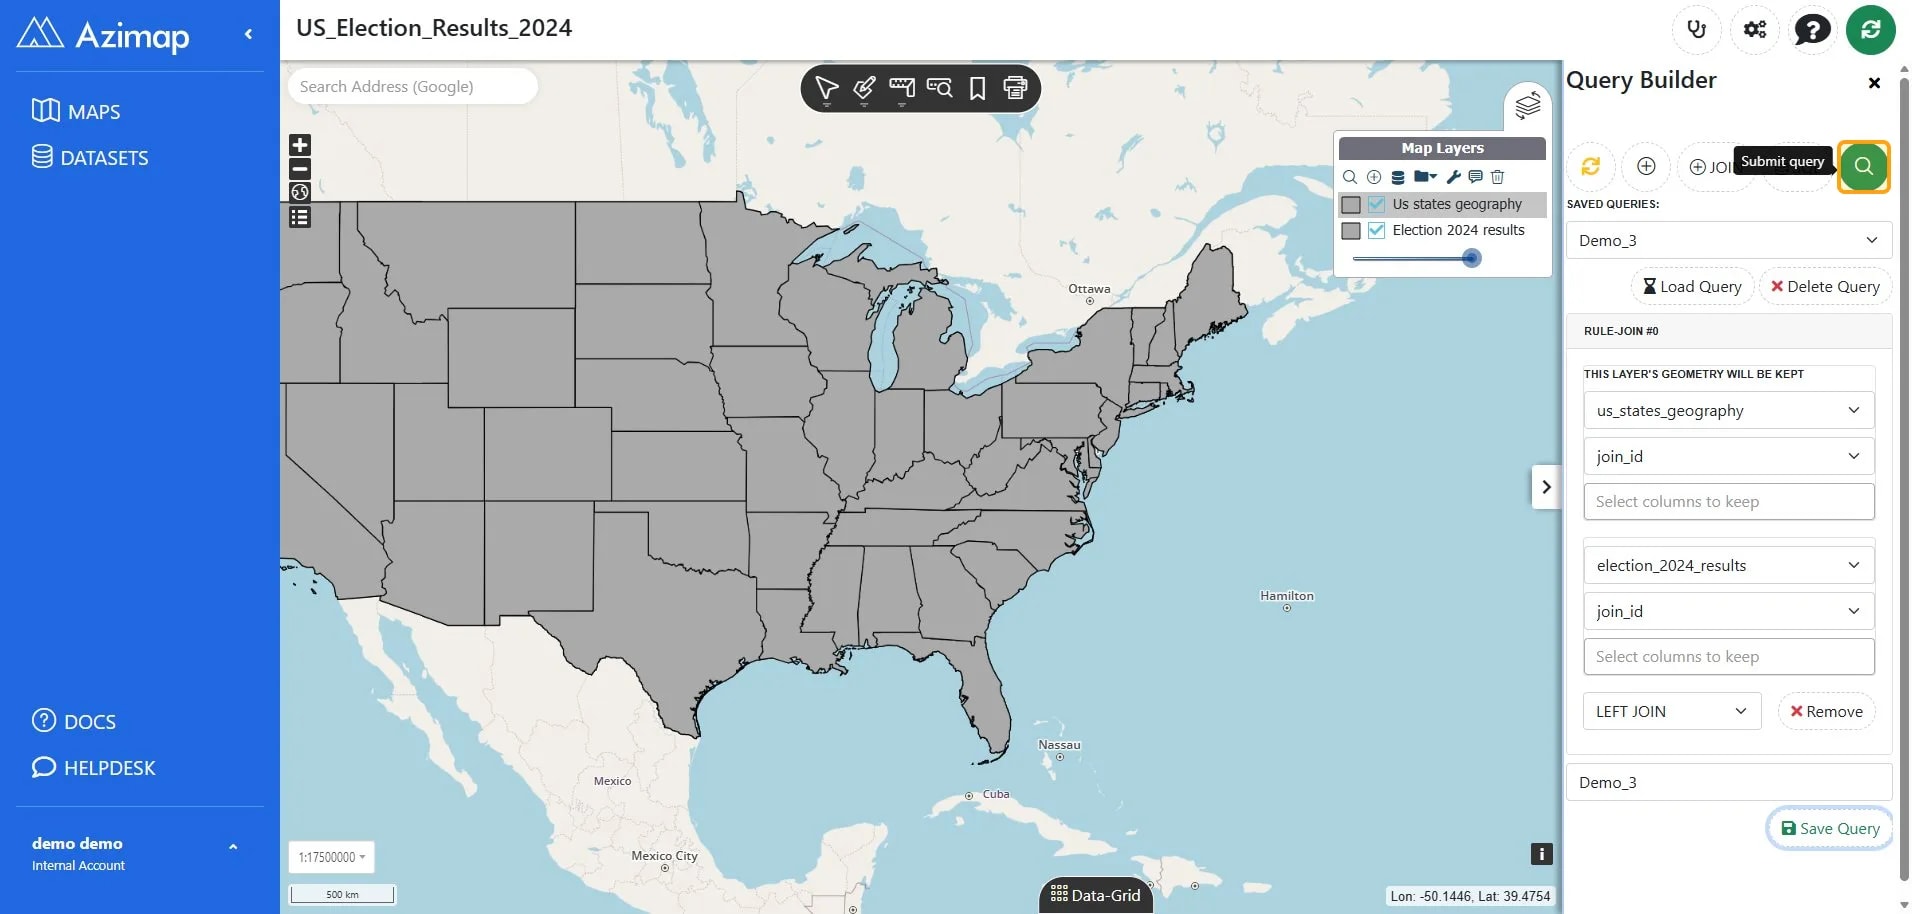
2.5. Verify the joined data
Open Data-Grid and confirm that the joined records include
the winner field.
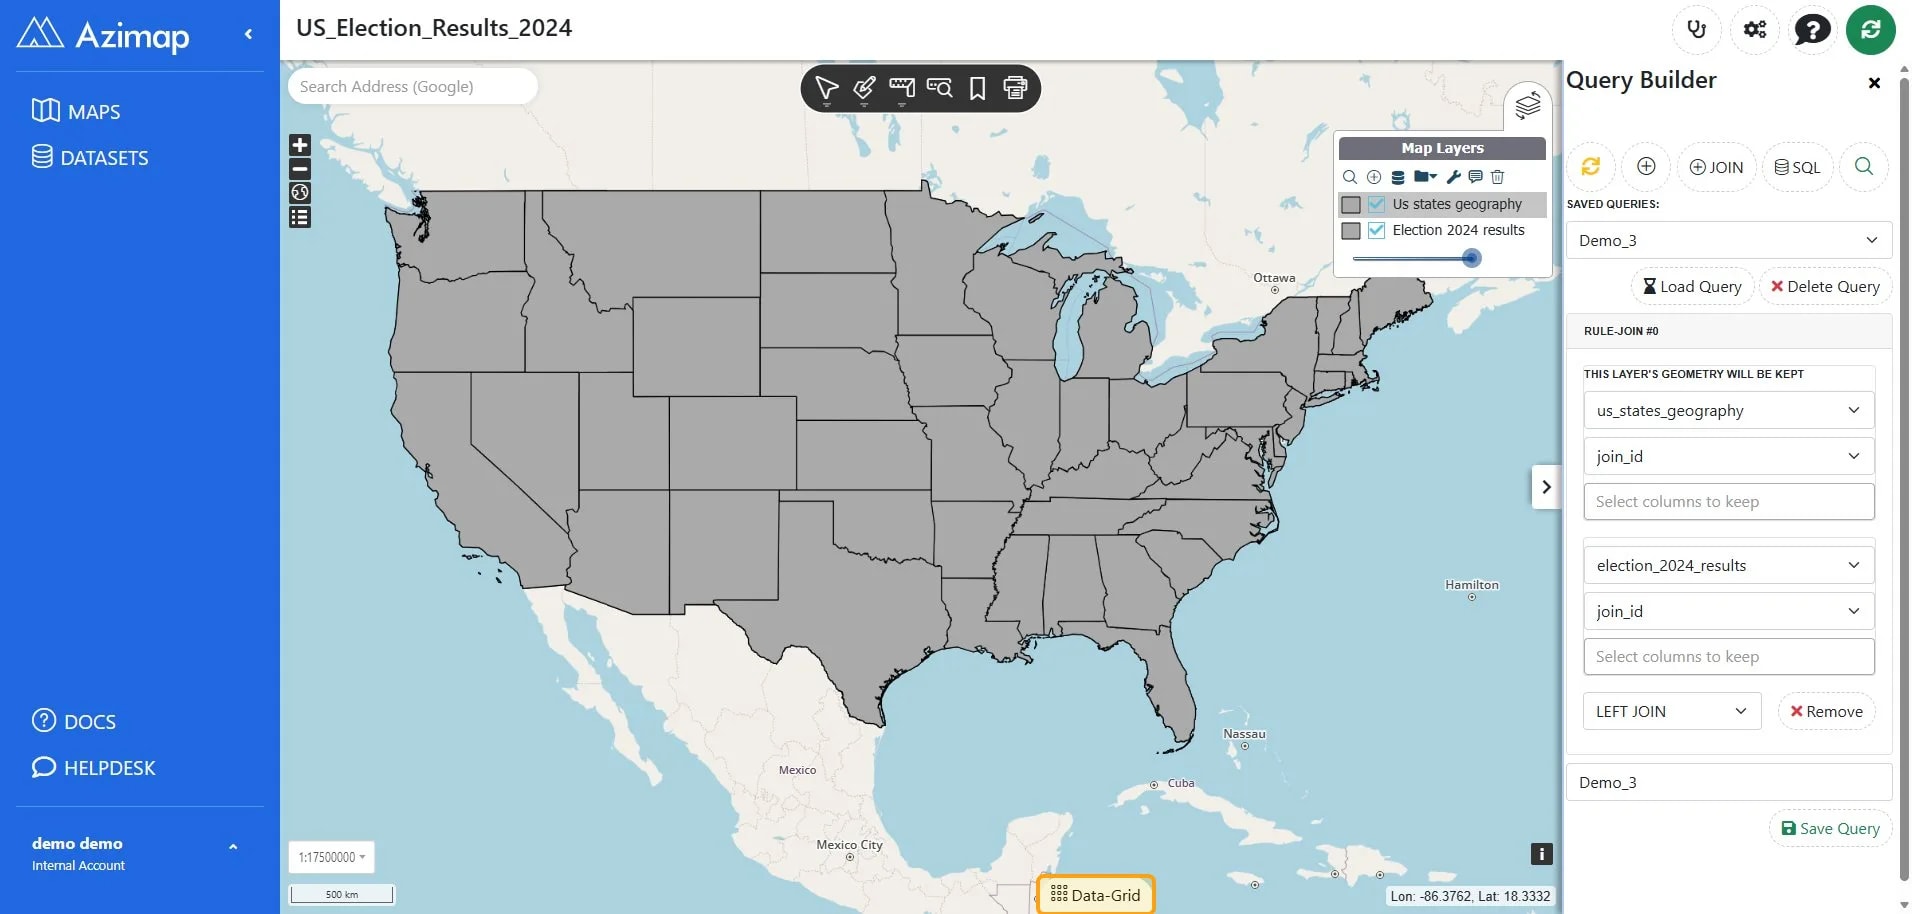
3. Style your new
layer (optional)
Style your layer to
make the most of the newly joined data. We styled a thematic map in the following way to visualises the 2024 US election results, showing which candidate received the most votes in each state. States are colour-coded by the winning candidate, making it easy to explore voting patterns across the country at a glance.
For advice on how
to create a choropleth map please see our guide.
That's it - Your
data is joined!!!
If you haven't
signed up yet go to the Azimap website and
click REGISTER.
US County Boundaries - Data source: U.S. Census Bureau – 2025 Cartographic Boundary Files · Reuse: U.S. Government data; source citation recommended · View Census boundary data
US Presidential Election 2024 Results ?- Data source: MIT Election Data and Science Lab – County Presidential Election Returns 2000–2024 · Licence: CC0 1.0 · View dataset in Harvard Dataverse
View full data sources & licensing information”