How to Import a Shape File and Create a Styled Thematic Choropleth Map
Choropleth maps show linked
data as colours. They are shaded in using one colour, where the darker shades represent high
numbers and the lighter shades represent low numbers. A choropleth
map needs a key to explain what the different shades mean. They differ from a heatmap because the
shading occurs within geographic boundaries, whereas a heatmap doesn’t utilise
boundary information.
In this guide we’ll show you how to import a shape file and create a styled
thematic choropleth map in just a few clicks.
Time to complete: 10 mins.
Contents
1. Getting started
1.1 Download required files
1.2 Create map
2. Styling
your new map
2.1 Create
new style
2.2 Configure
thematic style
2.3 Apply
style to map
1. Getting started
1.1. Download required files
Download the required dataset from the original provider before beginning this demonstration.
Required download:
[1] Download the US Presidential Election Results 2024 - View Official Source Data
[2] Download the US County Boundaries - Download Source Data
1.2. Create map
Upon successful import, a button appears which short-cuts adding the
layer to a map (it automatically creates a map for the layer). You need to navigate to the "MAPS" section within the window and click on "create map"
Give your map a name. For this example we will name the map "CholoplethMap"
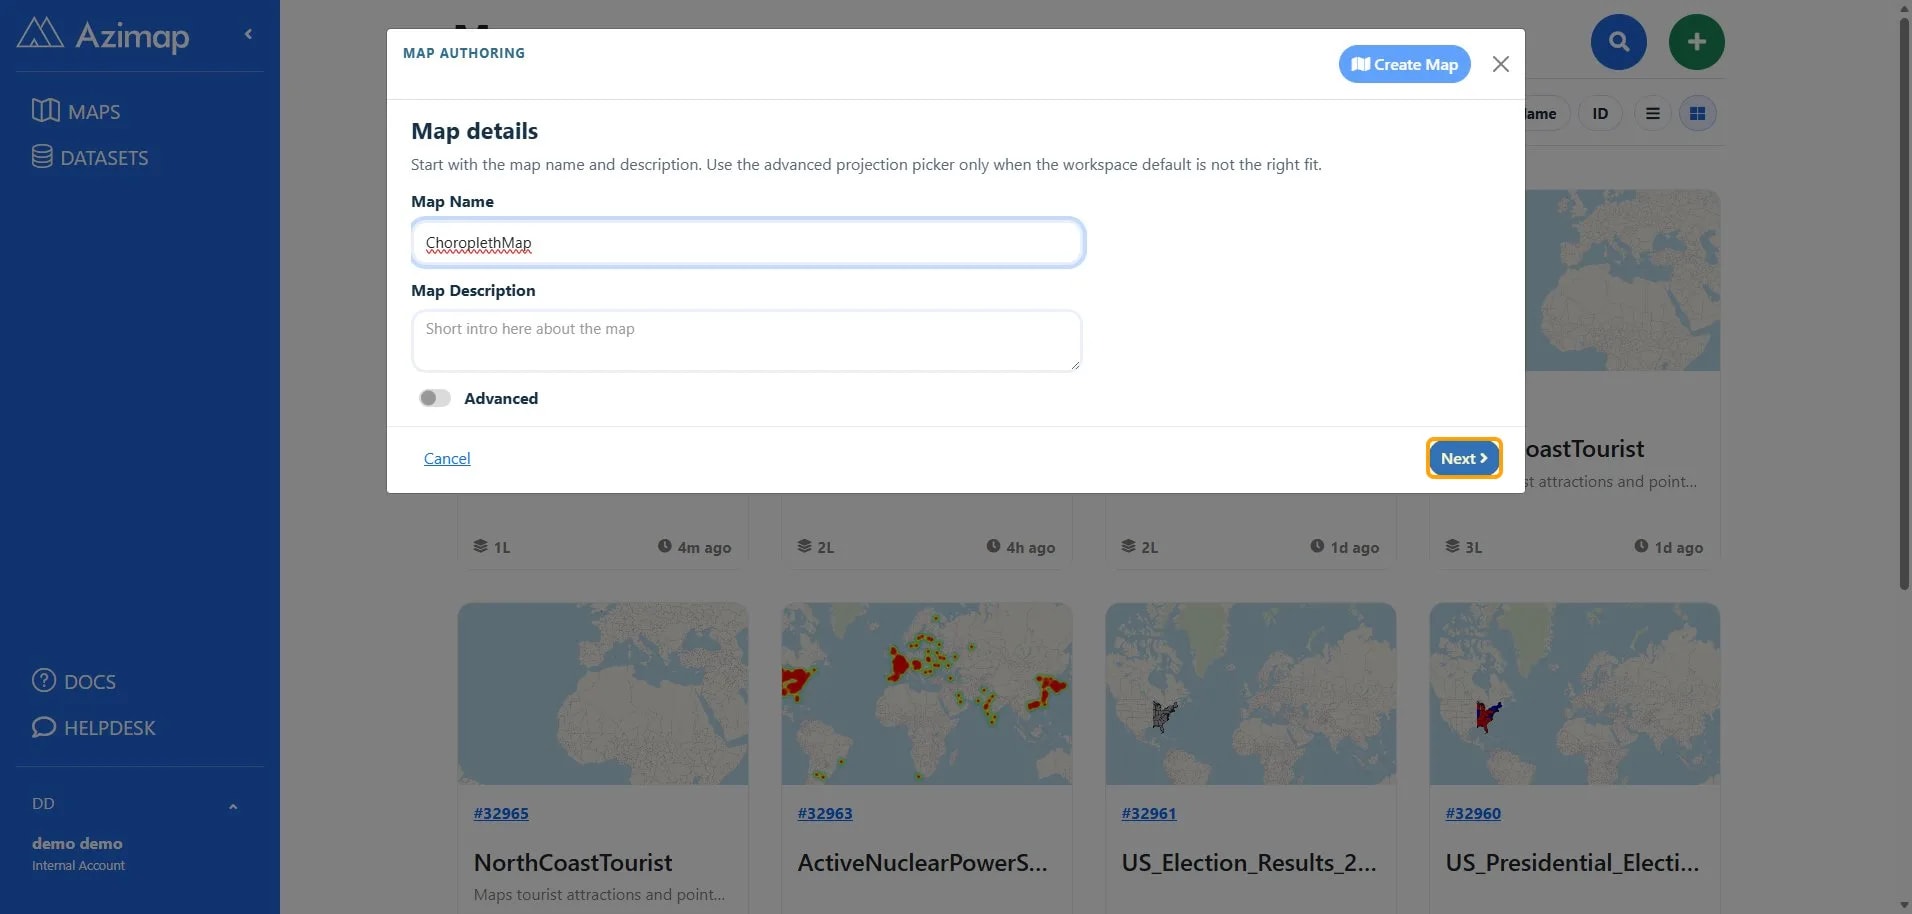
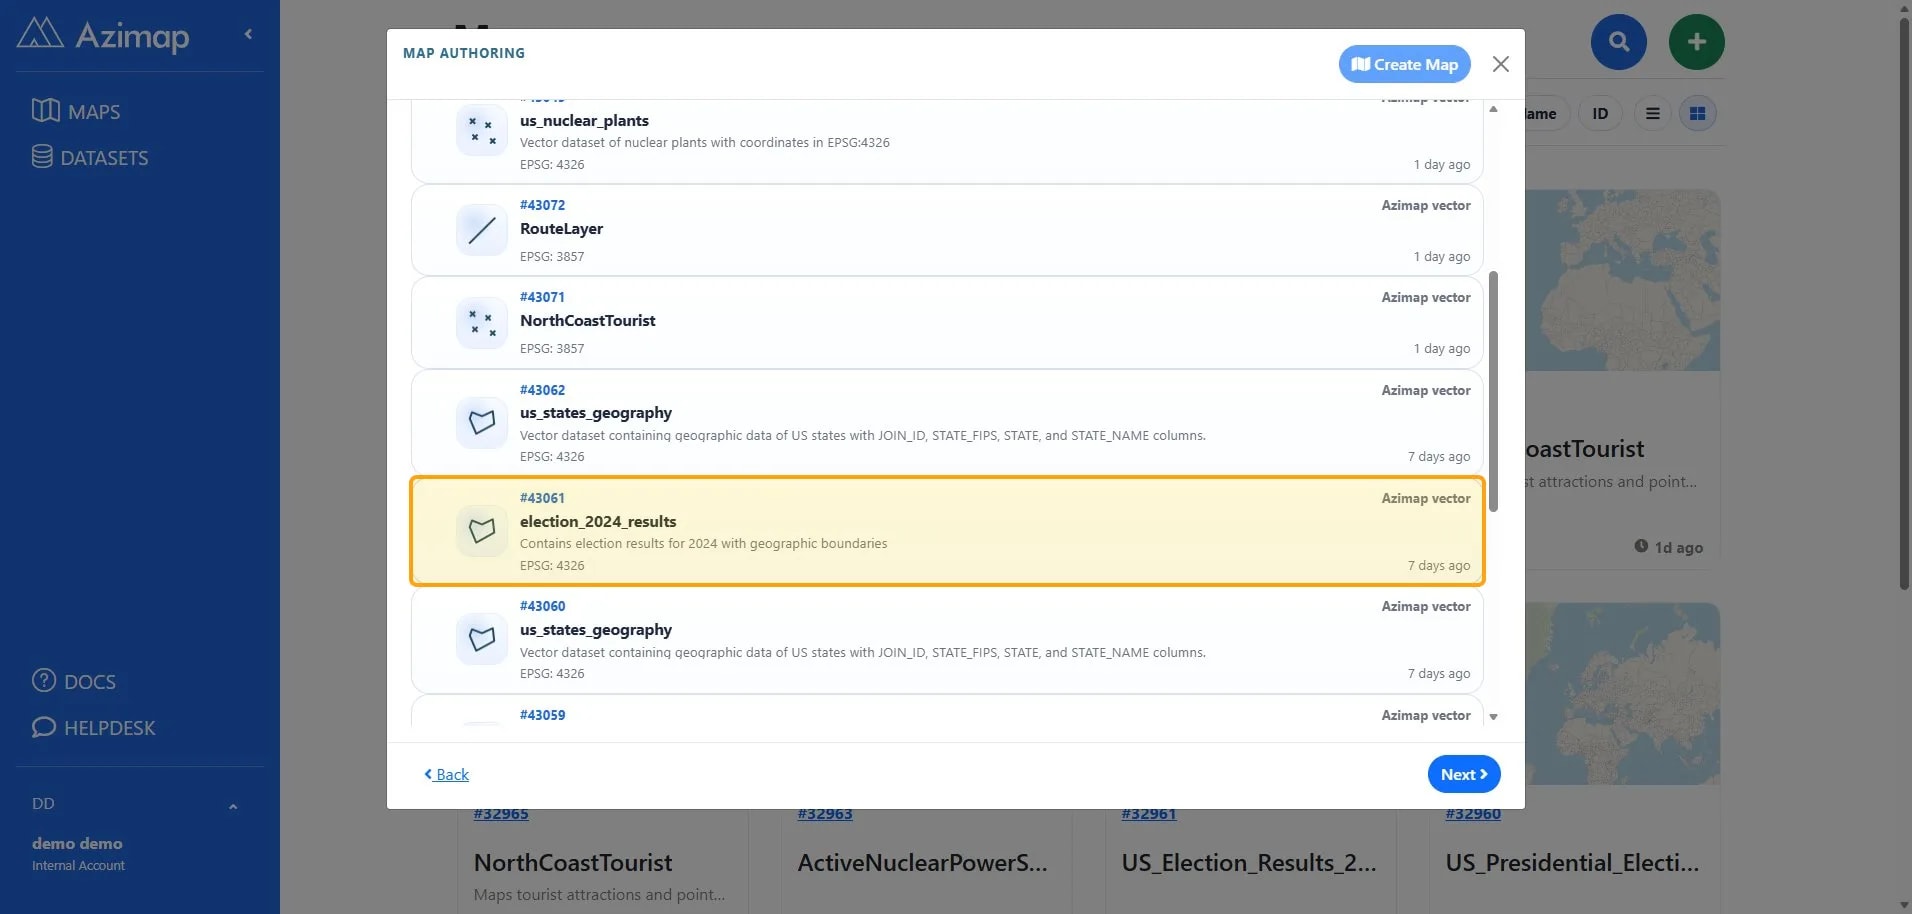
Click on the dataset we had created earlier - " election_2024_results" and click "Next"
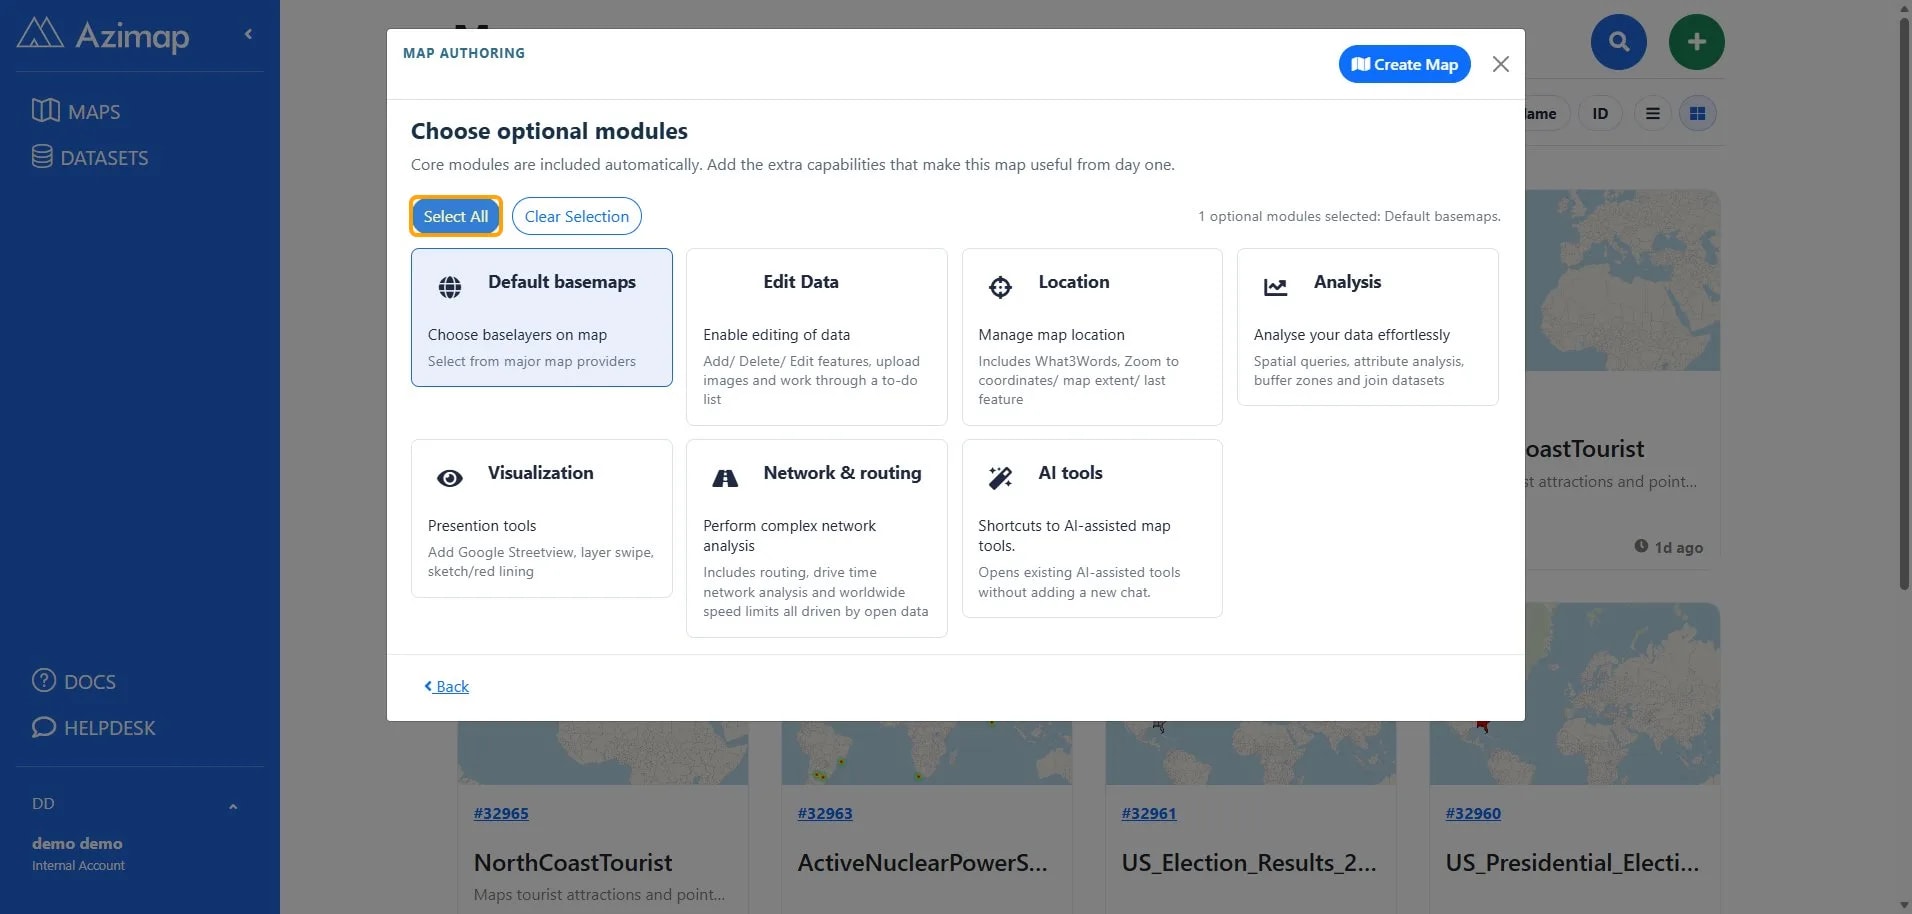
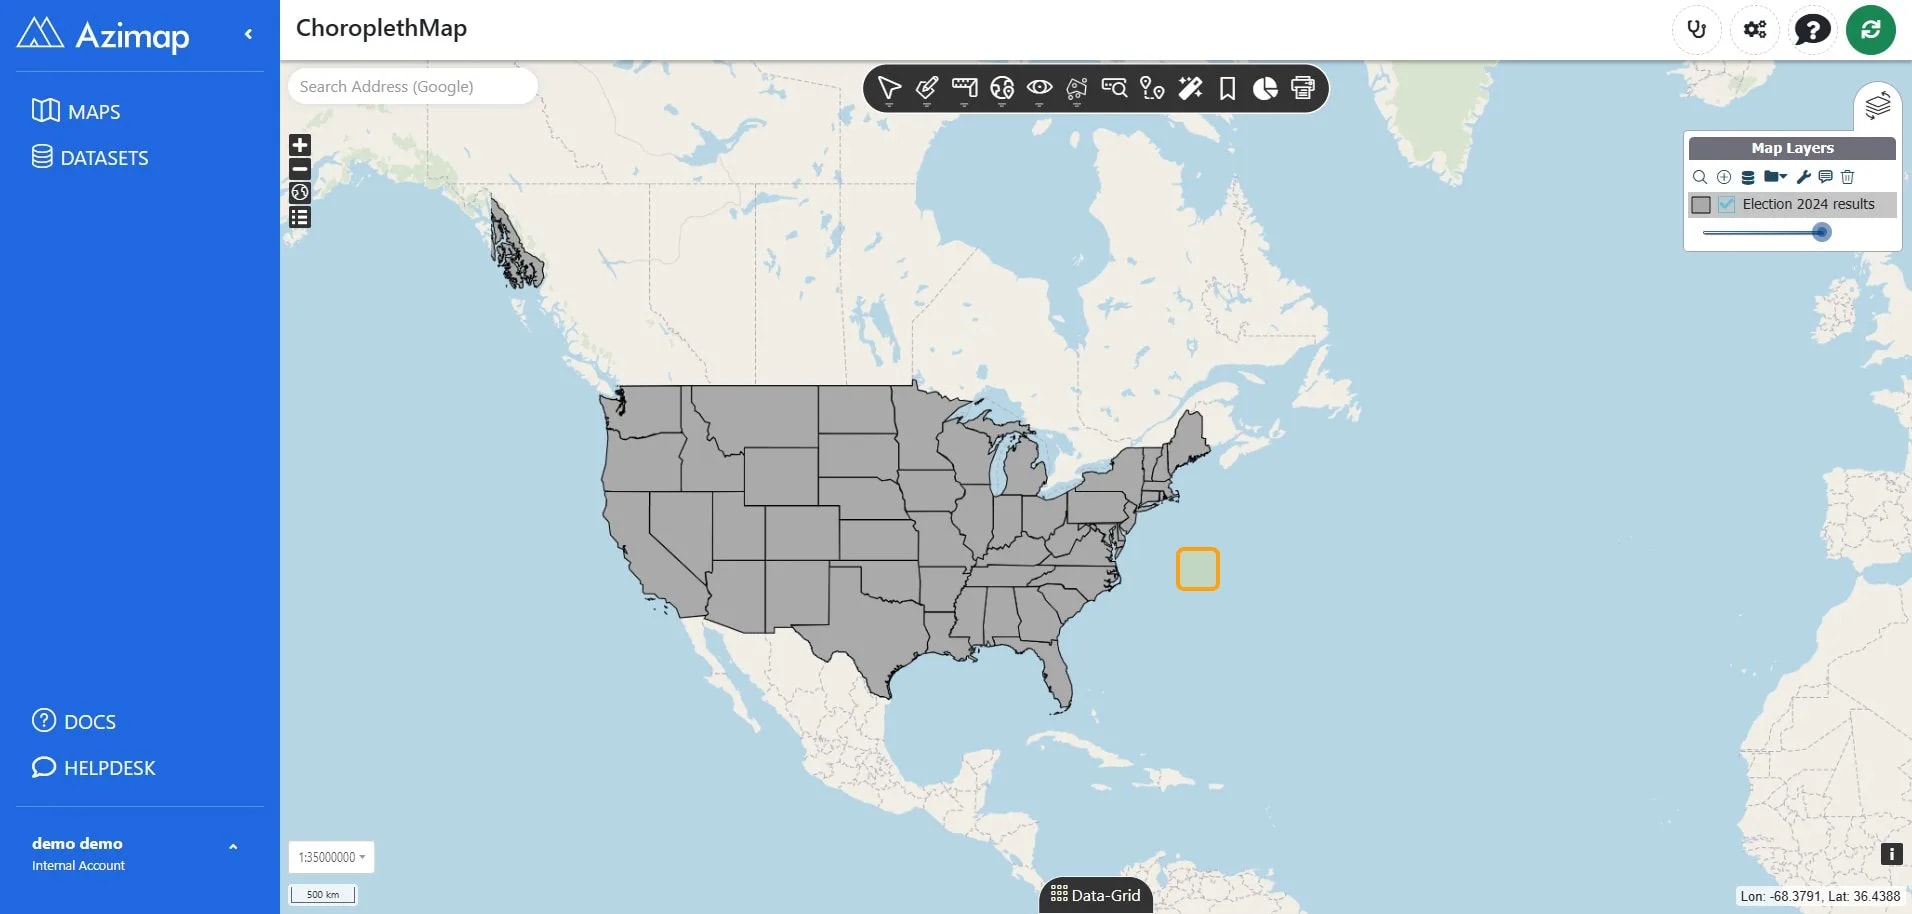
You will prompted with a window asking what kind additional map functions you would like access to with your new map. Click on "Select all". Confirm your choice by clicking "Create Map"
2. Styling your map
2.1. Create new style
Your new map will have the default style applied - To edit the style
click on the legend icon in the layer tree in the top right of the map 
In the styler wizard select the NEW STYLE
button, choose a name for your style and click save.
Select POLYGON THEMATIC STYLING from the ADD menu.
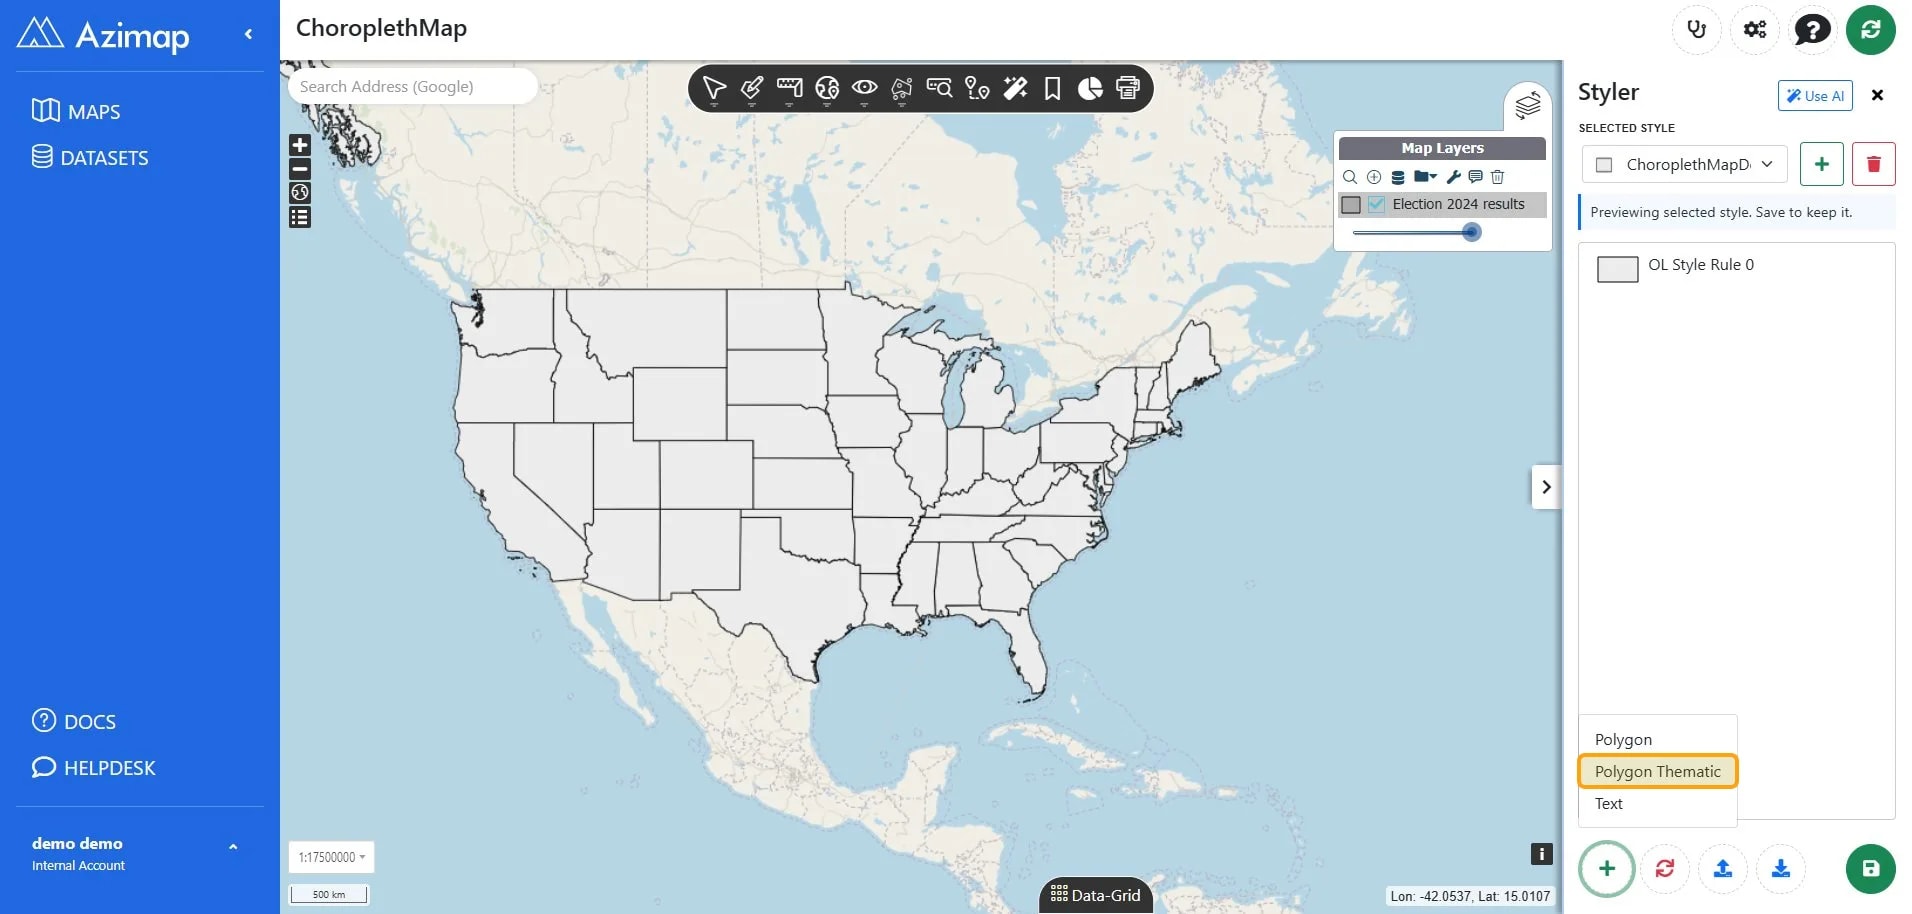
2.2. Configure thematic style
Select the attribute to style the map on from the ATTRIBUTE drop down
(for this layer choose zone_orig (this is the planning classifications for the
dataset):
- Choose your colour scheme using the EDIT
button - Choose from the presents (I chose Blue to Red) or select REFINE
to set your own.
- You can set opacity and stroke options in tab
1 (setup).
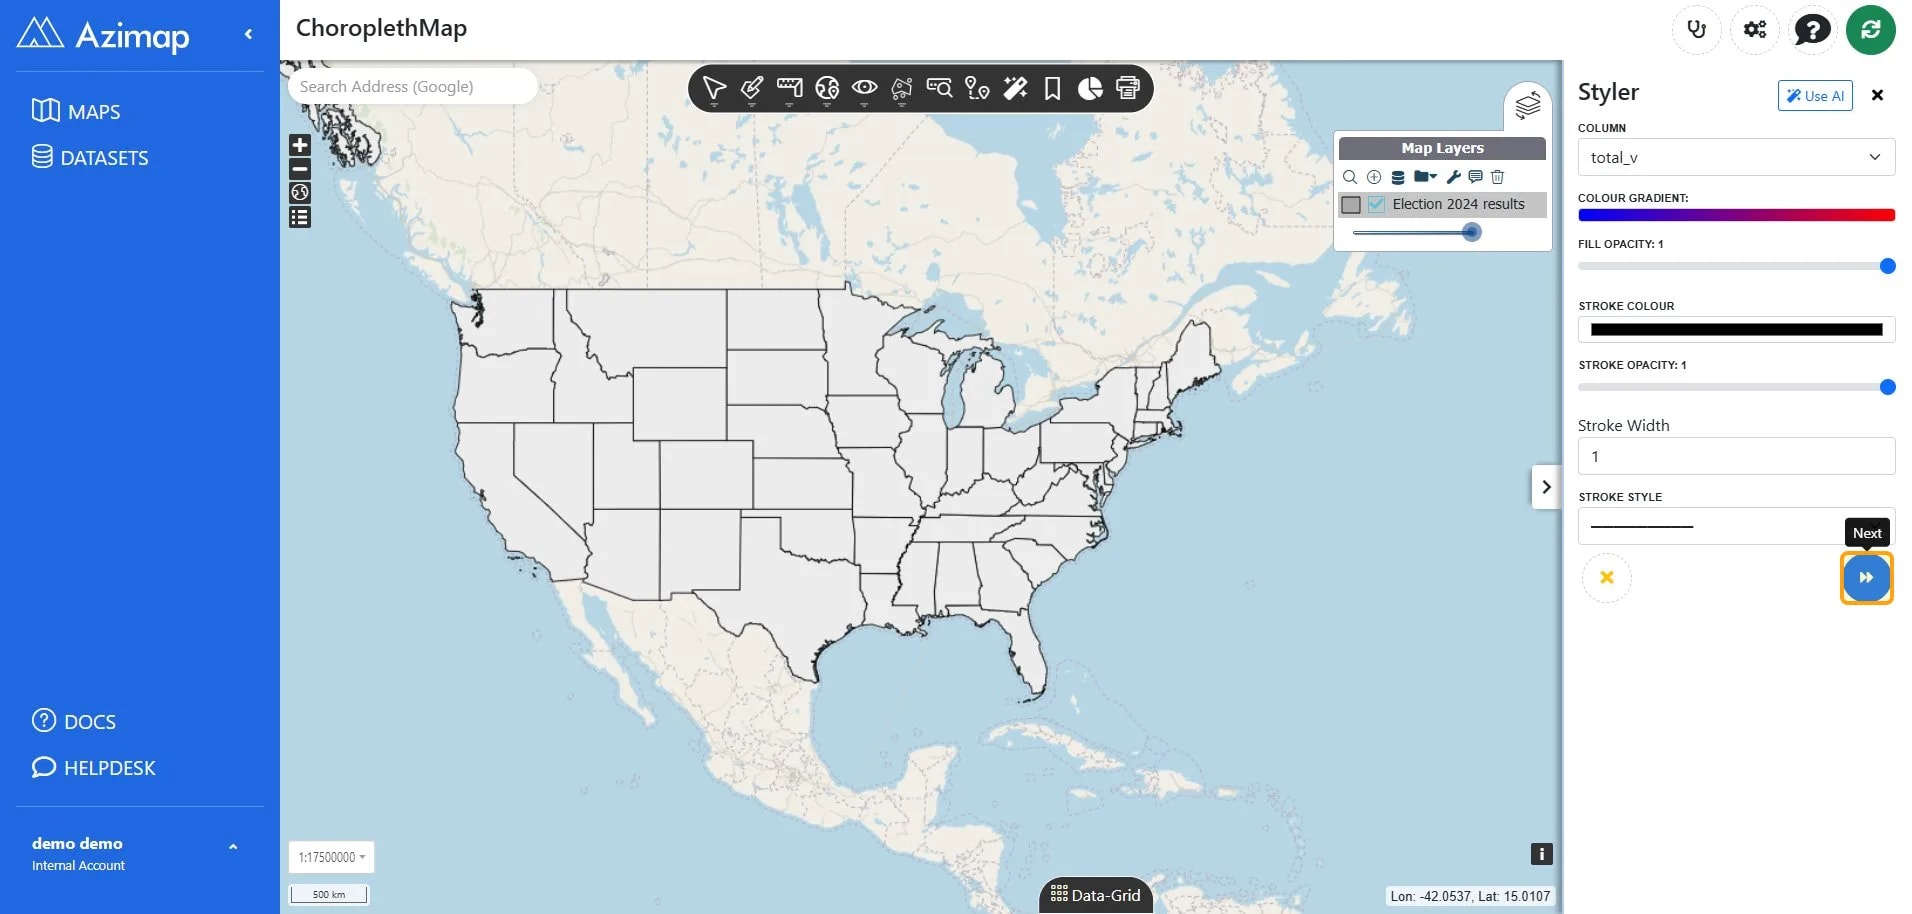
After you click "next" you will navigated to the 2nd part which allows you to set individual colours for each entry.
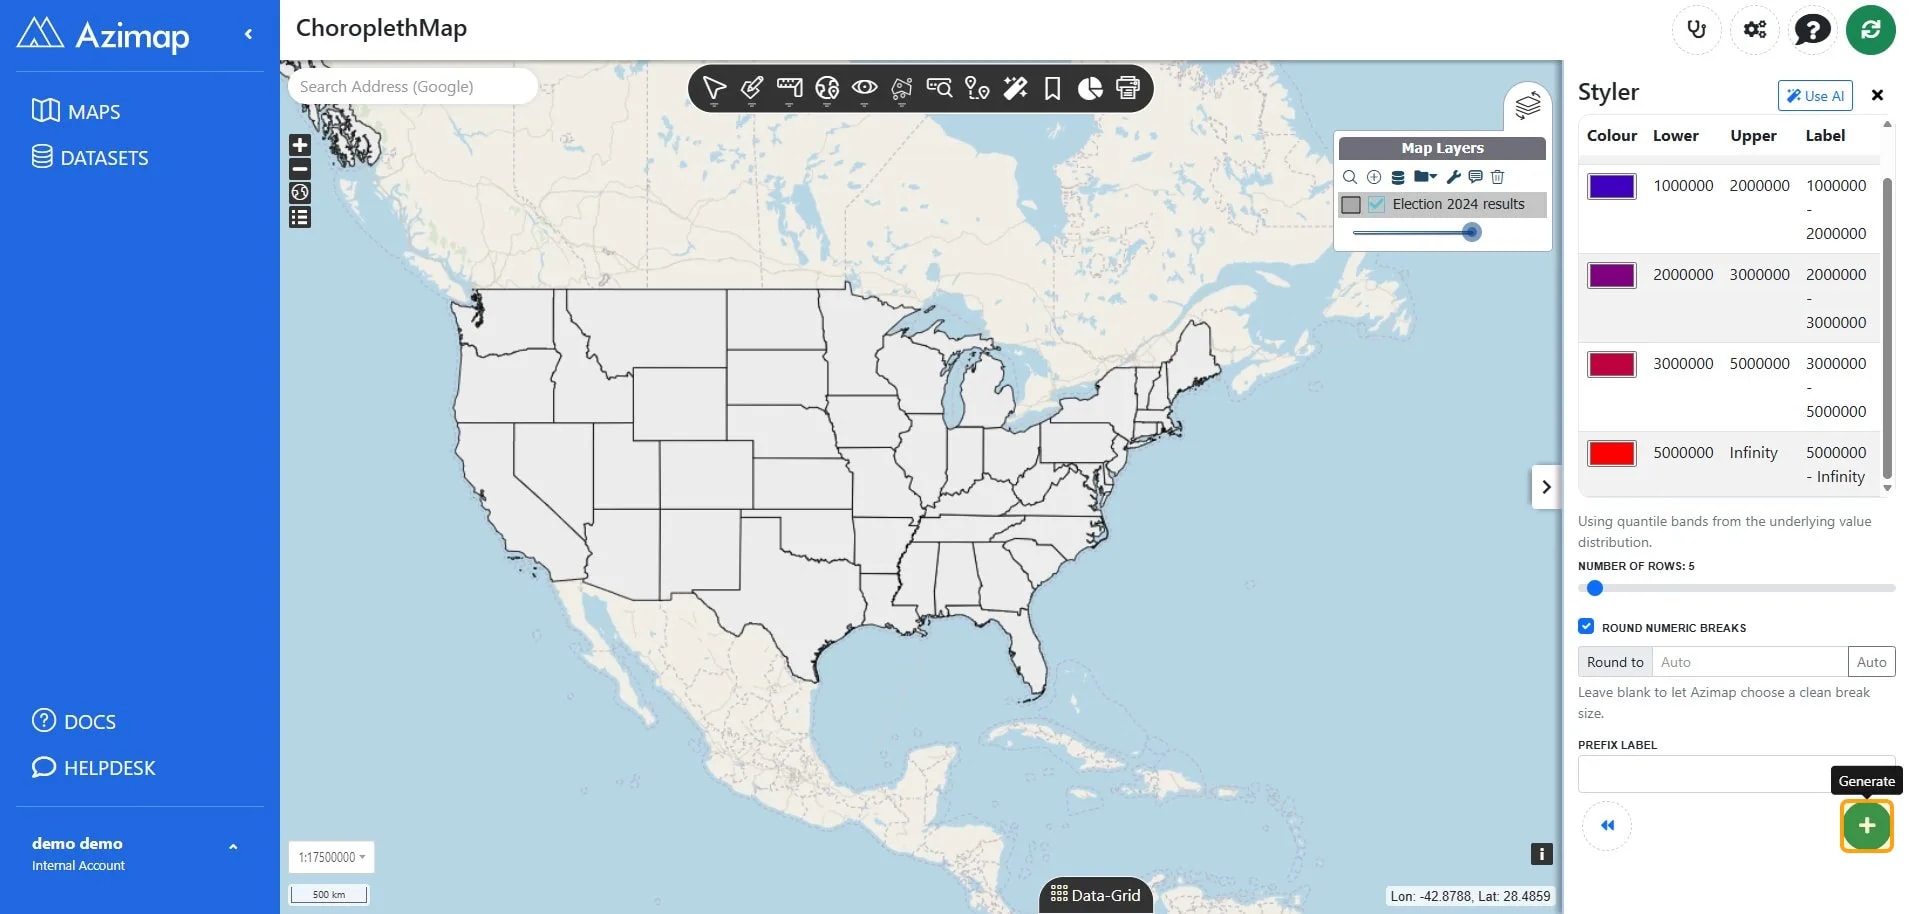
Click the 'Generate' button at the bottom of the menu and you will be presented with the auto-generated
rules for the thematic map.
Each of the generated rules can be clicked to edit
individual settings (but we don't need to for this guide).
2.3. Apply style to map
That's it - Thematic map created in minutes.
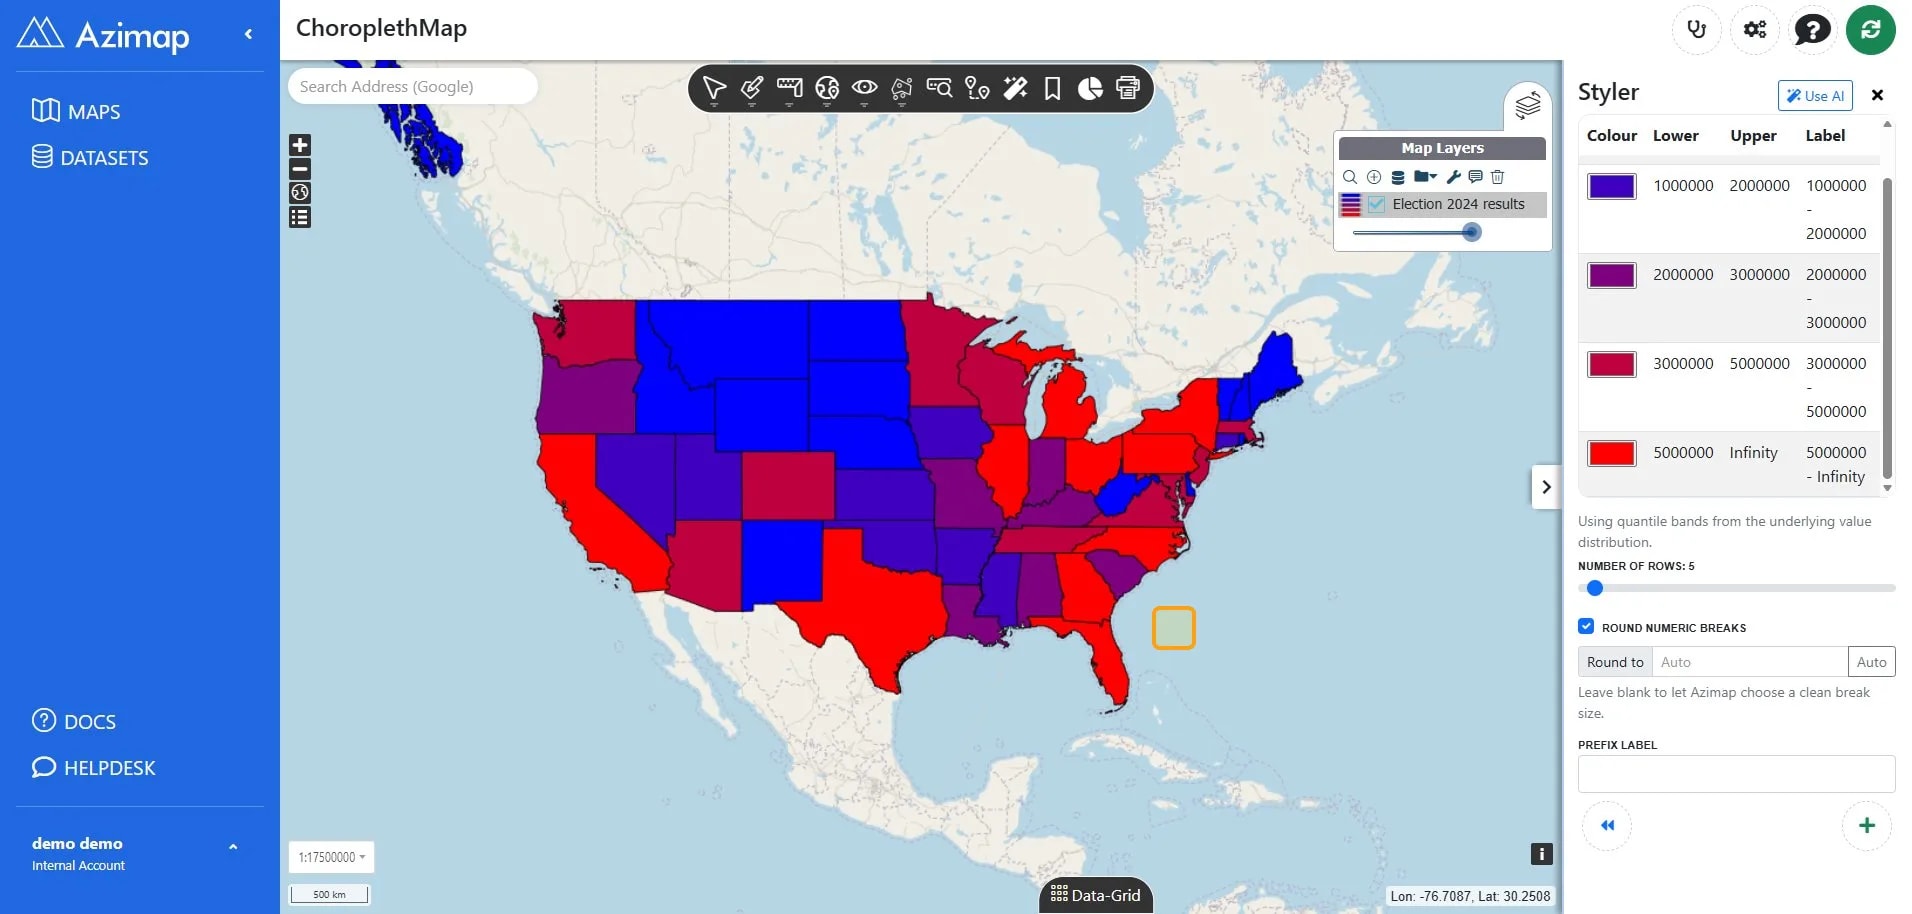
If you haven't signed up yet go to the Azimap website
and click REGISTER.
US County Boundaries
Data source: U.S. Census Bureau – 2025 Cartographic Boundary Files · Reuse: U.S. Government data; source citation recommended · View Census boundary data
US Presidential Election 2024 Results
Data source: MIT Election Data and Science Lab – County Presidential Election Returns 2000–2024 · Licence: CC0 1.0 · View dataset in Harvard Dataverse
View full data sources & licensing information