The New Azimap Interface
This guide gives an overview of the new Azimap user interface.
Contents
1.
Dashboard Screen
2.
Maps Tab
3.
Imports
4.
Search Function
5.
Data Catalogue Tab
6.
Datasets
7.
Admin Screens
8.
Map View
9.
Mobile UI Improvements
10.
Security Improvements
11.
Analysis Menu
12.
Routing and Drive Times Menu
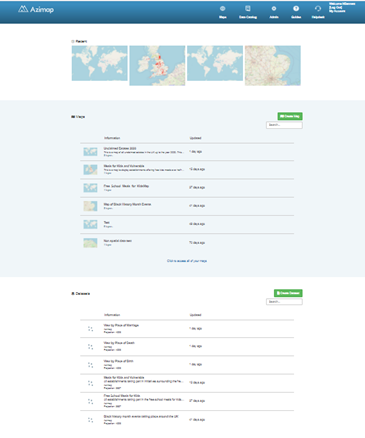
Dashboard
Screen
Azimap has a new ‘easy access’ dashboard instead of the old home
screen. This gives the user easy access
to the most recent data, maps and layers in their account and easy access to
some help files.
Maps Tab
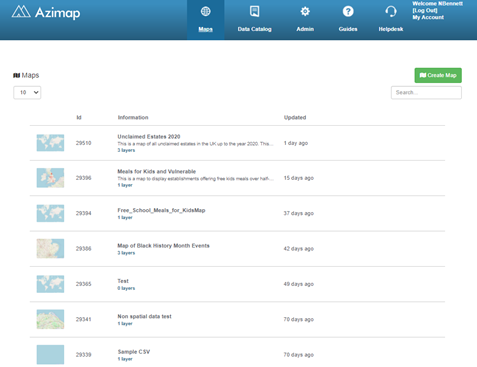
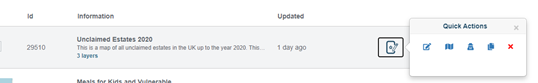
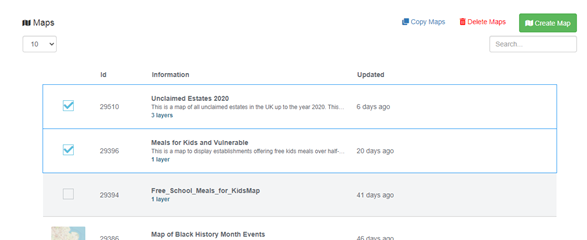
Quick actions
The user can now take a number of quick actions on any of
their pre-existing maps – they can easily make small changes or go into
advanced actions and with a user-friendly presentation.
By pressing the EDIT button next to the map on choice, the
user can quickly:
·
Edit name and description
·
Change privacy
·
Duplicate map
·
Delete map
·
Choose to edit full configuration
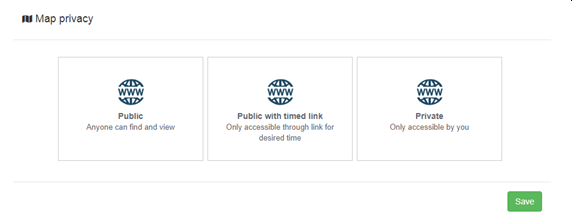
Advanced privacy settings
The privacy settings now include an option to have a timed public
link/share with expiration button. This means the user can share a map with one
person more safely and allows for better security than the completely public
option. Please note that a timed link
can be shared with anyone, so the link
Apply bulk functions
The new interface allows the user to apply bulk functions to
maps or make multi-edits by selecting many maps. Simply hover over the map icon and press the
tick box to select the map you want to apply the bulk edit to.
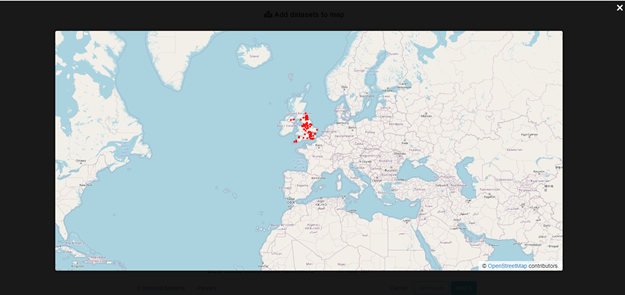
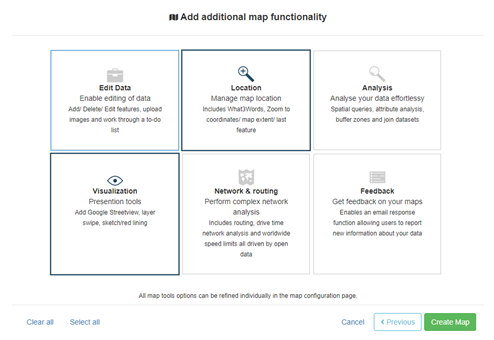
Streamlined map creation process
The new streamlined map creation process is designed to
guide the user to go through the correct process when creating a new map.
It offers a:
a.
Streamlined process for creating maps
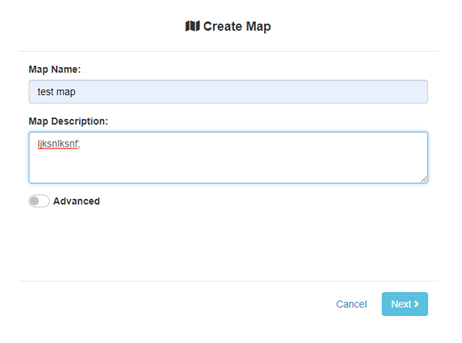
b.
Easy adding of new/existing layers or datasets
to the map
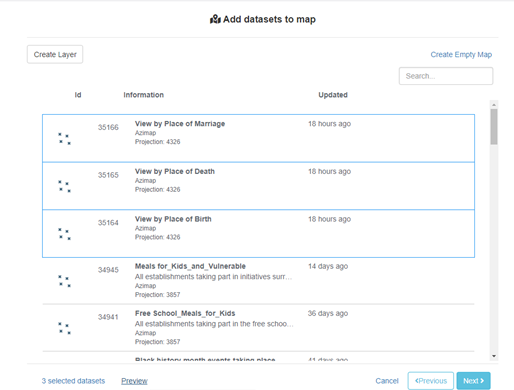
c.
Preview of maps before creation
d.
Guide for the user to selecting configurations
for their map
Imports
·
Failed imports will have better feedback
messages
·
Importing layers will be marked in yellow
Search Function
The new search function is optimised for better
search results.
Data Tab
There are a series of new and improved features of the Data Catalogue
tab. These include:
·
Improved speed and layout
·
Improved search function
·
Improved layer types
By clicking on CREATE OR CONNECT NEW DATASETS WITH AZIMAP when creating a
new dataset, the user will be able to select from a range of improved layer
types. These include:
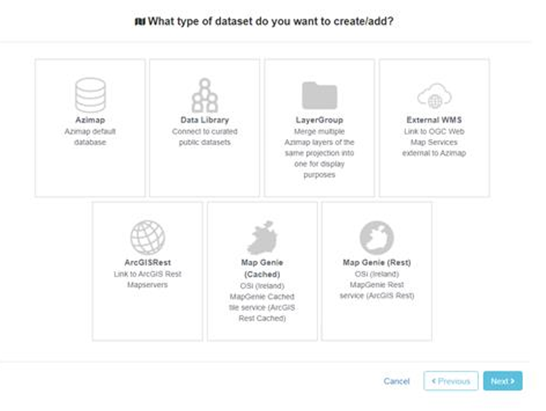
ü
Azimap
Allows the user to create data tables
within Azimap (image above is wrong)
ü
Data Library
The user can connect to curated public
datasets
ü
Layer Groups
Merge multiple Azimap layers of the same
projection into one for display purposes
ü
External WMS
Allows the user to link to OGC Web Map
Services external to Azimap
ü
ArcGIS Rest
Link to ArcGIS Rest map servers
ü Map
Genie (Cached)
Allows the user
to link to OSi (Ireland) MapGenie Cached tile service (ArcGIS Rest Cached)
ü
Map Genie (Rest)
Allows the user to link to OSi (Ireland)
MapGenie Rest service (ArcGIS Rest)
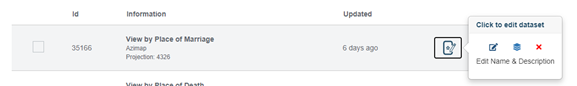
·
New quick edit menu
Allows the user to quickly edit a layer’s name and description, delete
the layer, or to quickly access the full configuration menu.

·
New apply an attribute at layer level
Attribution can now be applied at layer
level instead of at just map level as with the old Azimap.
When the dataset is added to a map the attribution will be
applied to the map layer, they can then be amended on a map
by map basis.
Datasets
In the new Azimap, the following accounts can create the
following datasets:
·
All accounts can CREATE NEW, IMPORT & CONVERT
ADDRESSES/GEOCODE
·
Pro and Enterprise accounts can do all of the above
plus CONNECT TO EXTERNAL DATABASES
Admin Screens
A number of changes to the admin screens mean they are now:
·
Visually updated
·
More unified look-wise
·
Friendly URLs
Map View
There have been a series of major improvements of the
following tools within the map view:
·
New bookmark button which allows
you to save a location. This feature is
available to any user whether logged in or not. If the user isn’t logged in, it
saves to their browser (and so will disappear if cache is cleared). Bookmarks
are also sharable.
·
Improved toolbar design has been streamlined
and categorised.
·
New walk-time polygons have been added (these
are based off open data).
·
New walking-based routing
·
Legend control has been moved to the bottom
right corner
·
Buffer tool has been opened up to export
data within a polygon. This is an easy way to use polygon analysis.
·
New – generate excel report of data
intersecting selected polygon feature
·
New – generate excel report of data
intersecting user generated “lasso” polygon
·
Significant speed improvements make load
times faster for users. Improved load
times of 50%+ across the board.
Mobile UI
Improvements
Everything on Azimap will work better on mobile and is more
user-friendly.
Security Improvements
Azimap is now more locked down with more refined security
processes.
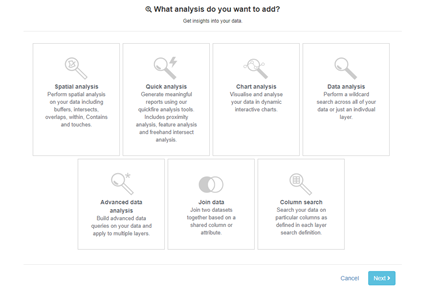
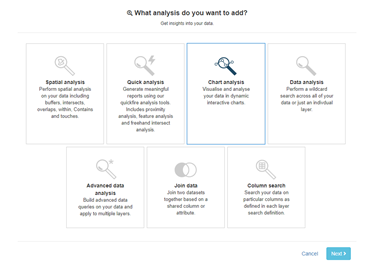
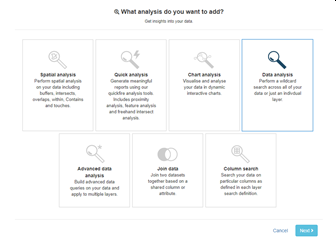
Analysis
Menu
The ANALYSIS button brings you to the beginning of an
analysis wizard, where all analysis options are displayed in a user-friendly
format, including:
·
Spatial analysis
·
Quick analysis
·
Chart analysis
·
Data analysis
·
Advanced data analysis
·
Join data
·
Column search

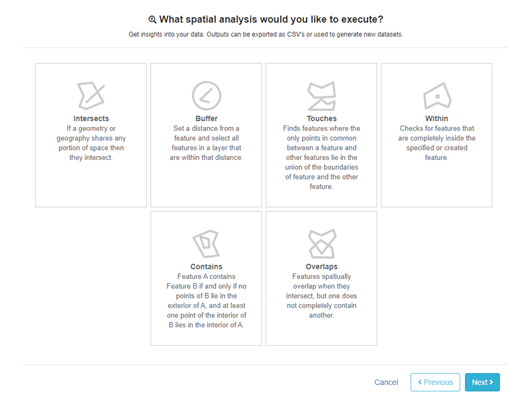
a. Spatial Analysis
Click on the SPATIAL ANALYSIS
button in the new menu.
Using this menu, you can perform spatial analysis on
your data. Analysis can be run against
selected features, freehand or layers.
Advanced users can also write SQL syntax queries. All the normal spatial analysis
functions will appear under this sub-menu, including:
·
Intersects
·
Buffer
·
Touches
·
Within
·
Contains
·
Overlaps
Related Azimap guides:
How to Analyse Your Data Using the Spatial Analysis Tool - https://docs.azimap.com/SelKb?id=5
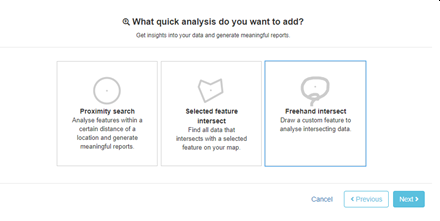
b. Quick Analysis
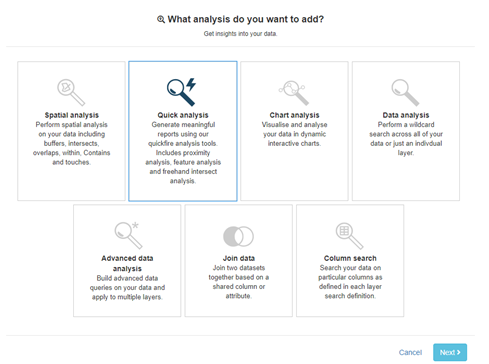
You have a number of further choices when you click into the
QUICK ANALYSIS option. One option that
has been enhanced is the FREEHAND INTERSECT option.
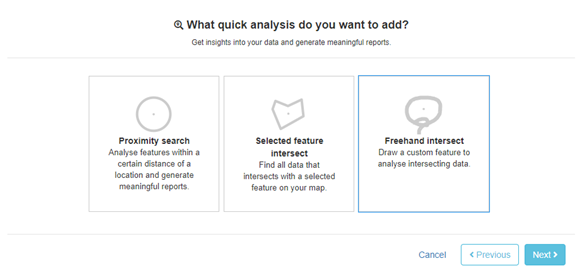
i.
Freehand Feature Analysis
FREEHAND INTERSECT, otherwise known as FREEHAND FEATURE
ANALYSIS select is found under the Quick Analysis menu, as below.
The Freehand Intersect feature is not a new one but
it has been upgraded so it now shows up a report.
Each quick analysis can be
saved and/or the results exported into Excel or CSV.
c. Charts Analysis
CHARTS ANALYSIS feature on Azimap is a brand-new feature
comprising of the following:
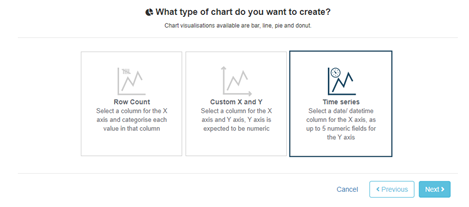
·
Row Count
·
Custom X & Y
·
Time Series
More information is provided on each of these charts below.
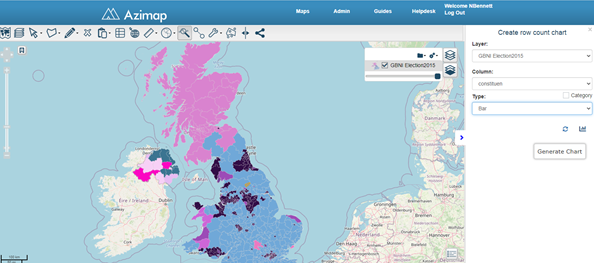
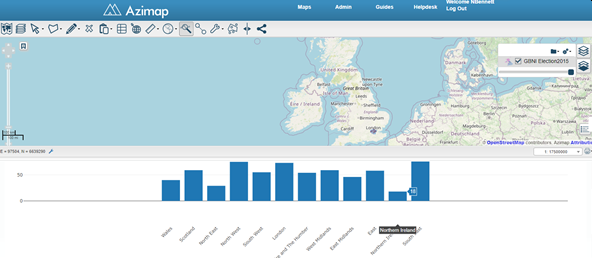
i.
Row count
The
ROW COUNT allows you to count how many fields are in a dataset. We are using a set of UK election data for
this example. The window on the right of
the screen shows what information needs to be inputted and how to generate the
chart.
In
this example, the bar chart we generated has counted the number of
constituencies in each area.
ii.
Custom X & Y
With a CUSTOM X & Y chart, you can customise your own
charts and perform basic statistical analysis e.g. – max., min., mean, median,
mode, SD, etc.
o
Y – Can only numbers
o
X – Can be numbers or strings
In
this example, we’re using the same election data to create a custom X &
Y chart.
In the window on the right, you can see what information
needs to be inputted and how to generate the chart.
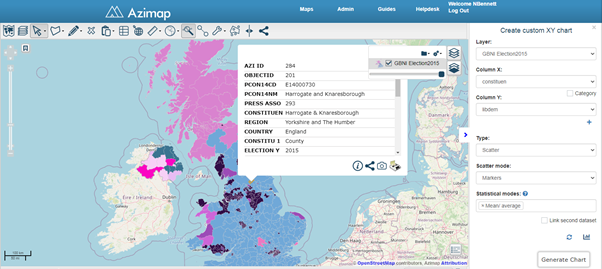
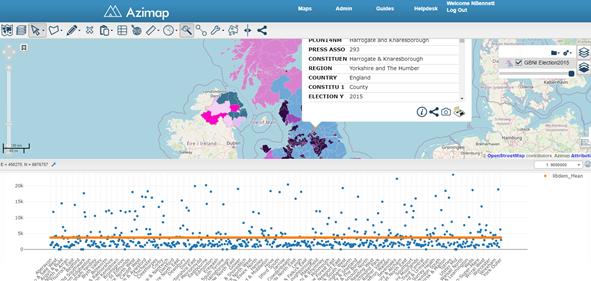
The
above chart has been produced and can be exported as PDF or a PNG.
iii.
Time Series
For
a TIME SERIES chart, you can select a date/datetime columns for the X-axis, as
well as up to 5 numeric fields for the Y-axis.
X
– has to be a date
Y
– has to be a number
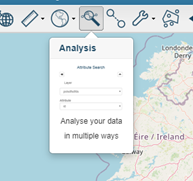
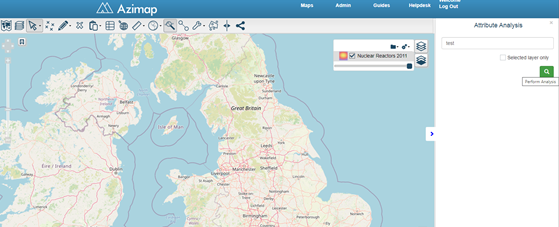
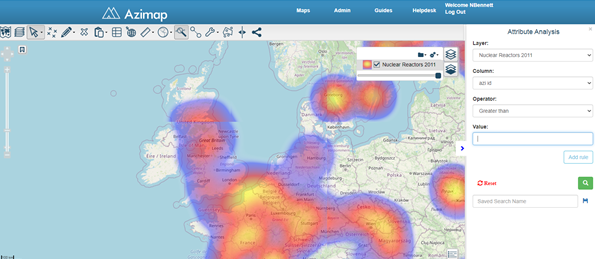
d. Data Analysis
The DATA ANALYSIS function used to be referred to as the ‘Attribute
Search’ and is now also known as the ‘Attribute Analysis’.
This function is now found under the Analysis menu but
largely does the same thing. See screen
shot below for the free text search box on the right, that can be used to
search for text within the attributes on a given layer.
e. Advanced Data Analysis
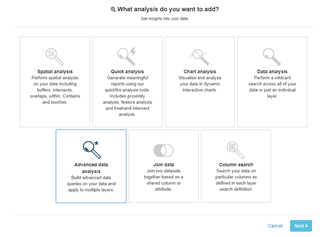
The ADVANCED DATA ANALYSIS function is changing slightly as
you can now build advanced data queries on your data and apply to multiple
layers.
f. Join Data
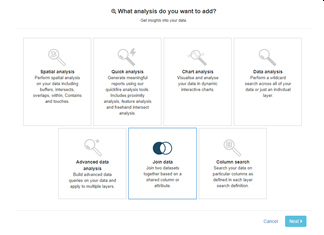
The JOIN DATA function is now also grouped under the
Analysis menu. This function also allows
you to link two datasets that share a common attribute or column.
Related Azimap guides:
How to Join Two Layers - https://docs.azimap.com/SelKb?id=31
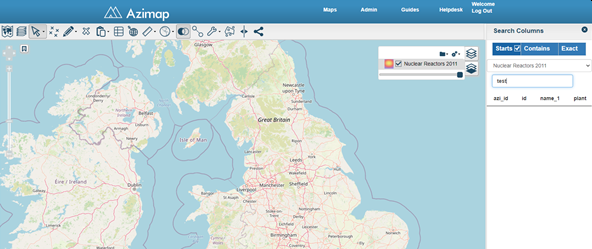
g. Column Search
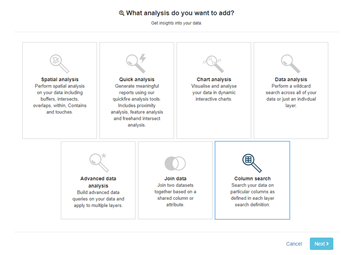
The COLUMN SEARCH function can also be found under the
Analysis menu but its functionality hasn’t changed. See screen shot below for the free text
search box on the right, that can be used to search for text within the columns
on a given layer.
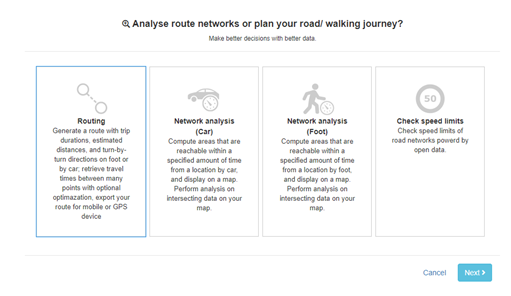
Routing
and Drive Times Menu
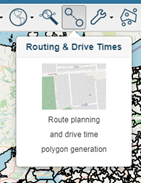
The ROUTING AND DRIVE TIMES function has a new menu. The new menu looks good and is more
user-friendly, however most functions on this remain unchanged compared to the
last interface.
Related Azimap guides:
How to Calculate Drive-Time Polygons - https://docs.azimap.com/SelKb?id=7
How to Use Route Planning - https://docs.azimap.com/SelKb?id=4