How to Analyse Your Data Using The Spatial Analysis Tool
Spatial analysis is a type
of geographical analysis used to explain patterns of human
behaviour and its spatial expression in terms of mathematics
and geometry, i.e. locational analysis.
In this guide we will show you how to analyse your data using the Azimap
Spatial Analysis tool. We’ll use
a working example, importing two shape (zipped) files of nuclear reactors, and
performing some spatial analysis on them.
Time to complete: 20 mins.
Contents
1. Getting started
1.1 Download files
1.2 Create a new map
1.3 Import data and add to map2. Spatial
analysis
2.1 Functions
of the spatial analysis wizard
2.1.1 Explanation
of basic functions
2.1.2 Explanation
of advanced functions
2.2 Basic
and advanced functions in use
2.2.1 Intersects
2.2.2 Overlaps,
Within, Contains, Touches
2.2.3 Buffer
select
2.2.4 Advanced
1. Getting started
1.1. Download files
This demo uses a third-party dataset that must be downloaded from the original data provider before you begin. Use the Download Source Data link below to download the required file directly from the official source. Once downloaded, you can use the file with Azimap by following the steps in this demo.
Please note: Azimap does not host or maintain this dataset. The original provider may update or replace the file, so we recommend downloading the latest available version from the source.
Download files before starting
US Nuclear Power Plants View Official Source Data
US County Boundaries Download Source Data
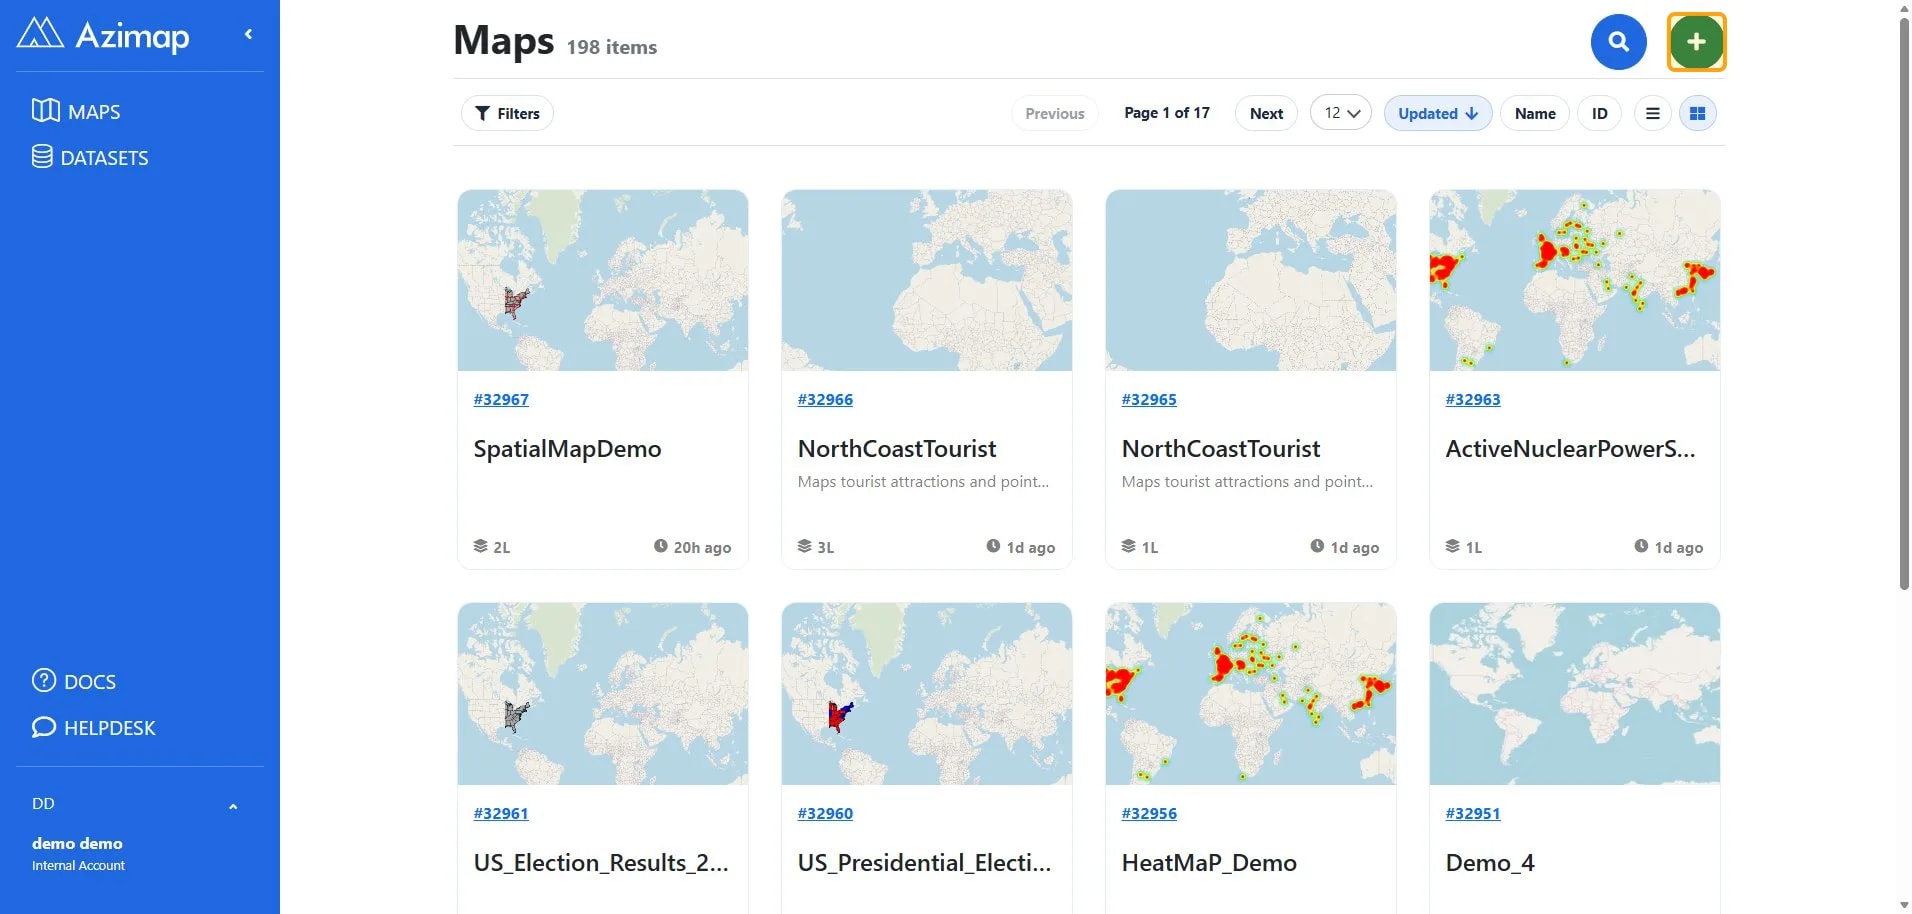
1.2. Click on MAPS section and CREATE MAP
Press the CREATE MAP button.
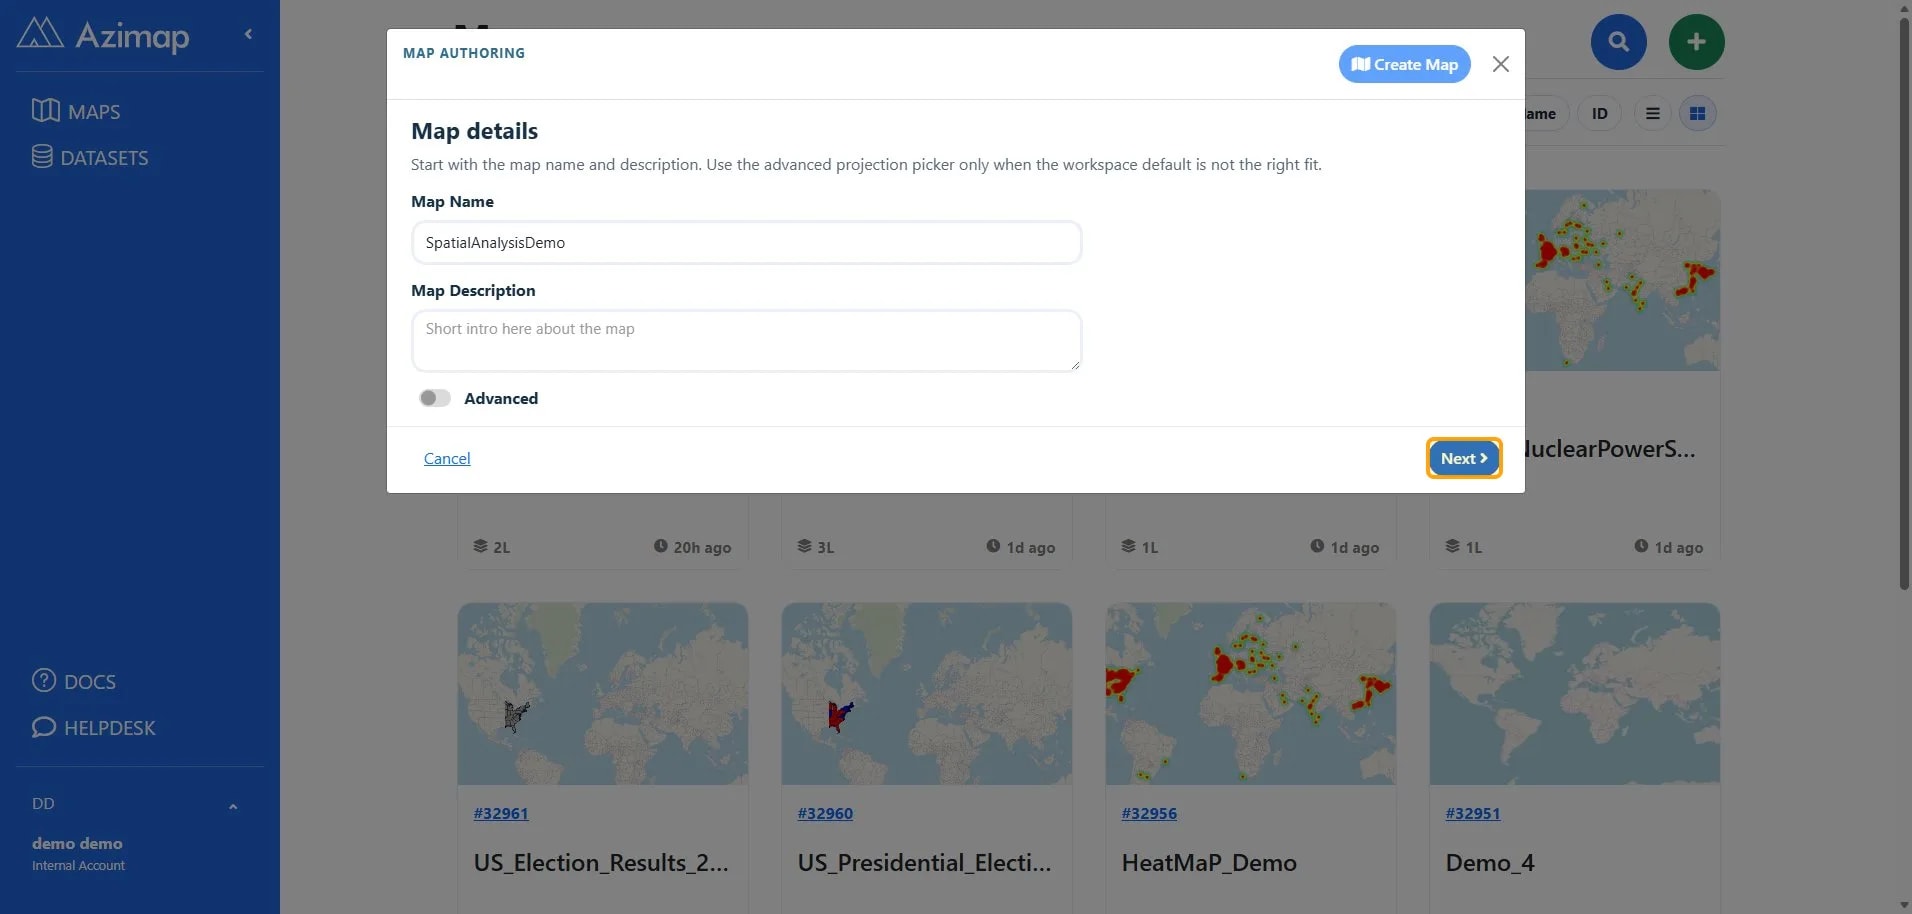
When you enter the map creation wizard, name your new map and click NEXT.
1.3. Import data and add to map
The next step in the map creation wizard is 'Add Datasets to Map'. You have a few options here: You can create a new layer to add to your map, you can choose to add one or many of your existing layers to your map, or you can create an empty map with no layers.
In this case however, we'll choose
the CREATE DATASET button (this is also accessible on the map using the gears
button on the layer tree view). You'll be prompted with the below
pop-up.
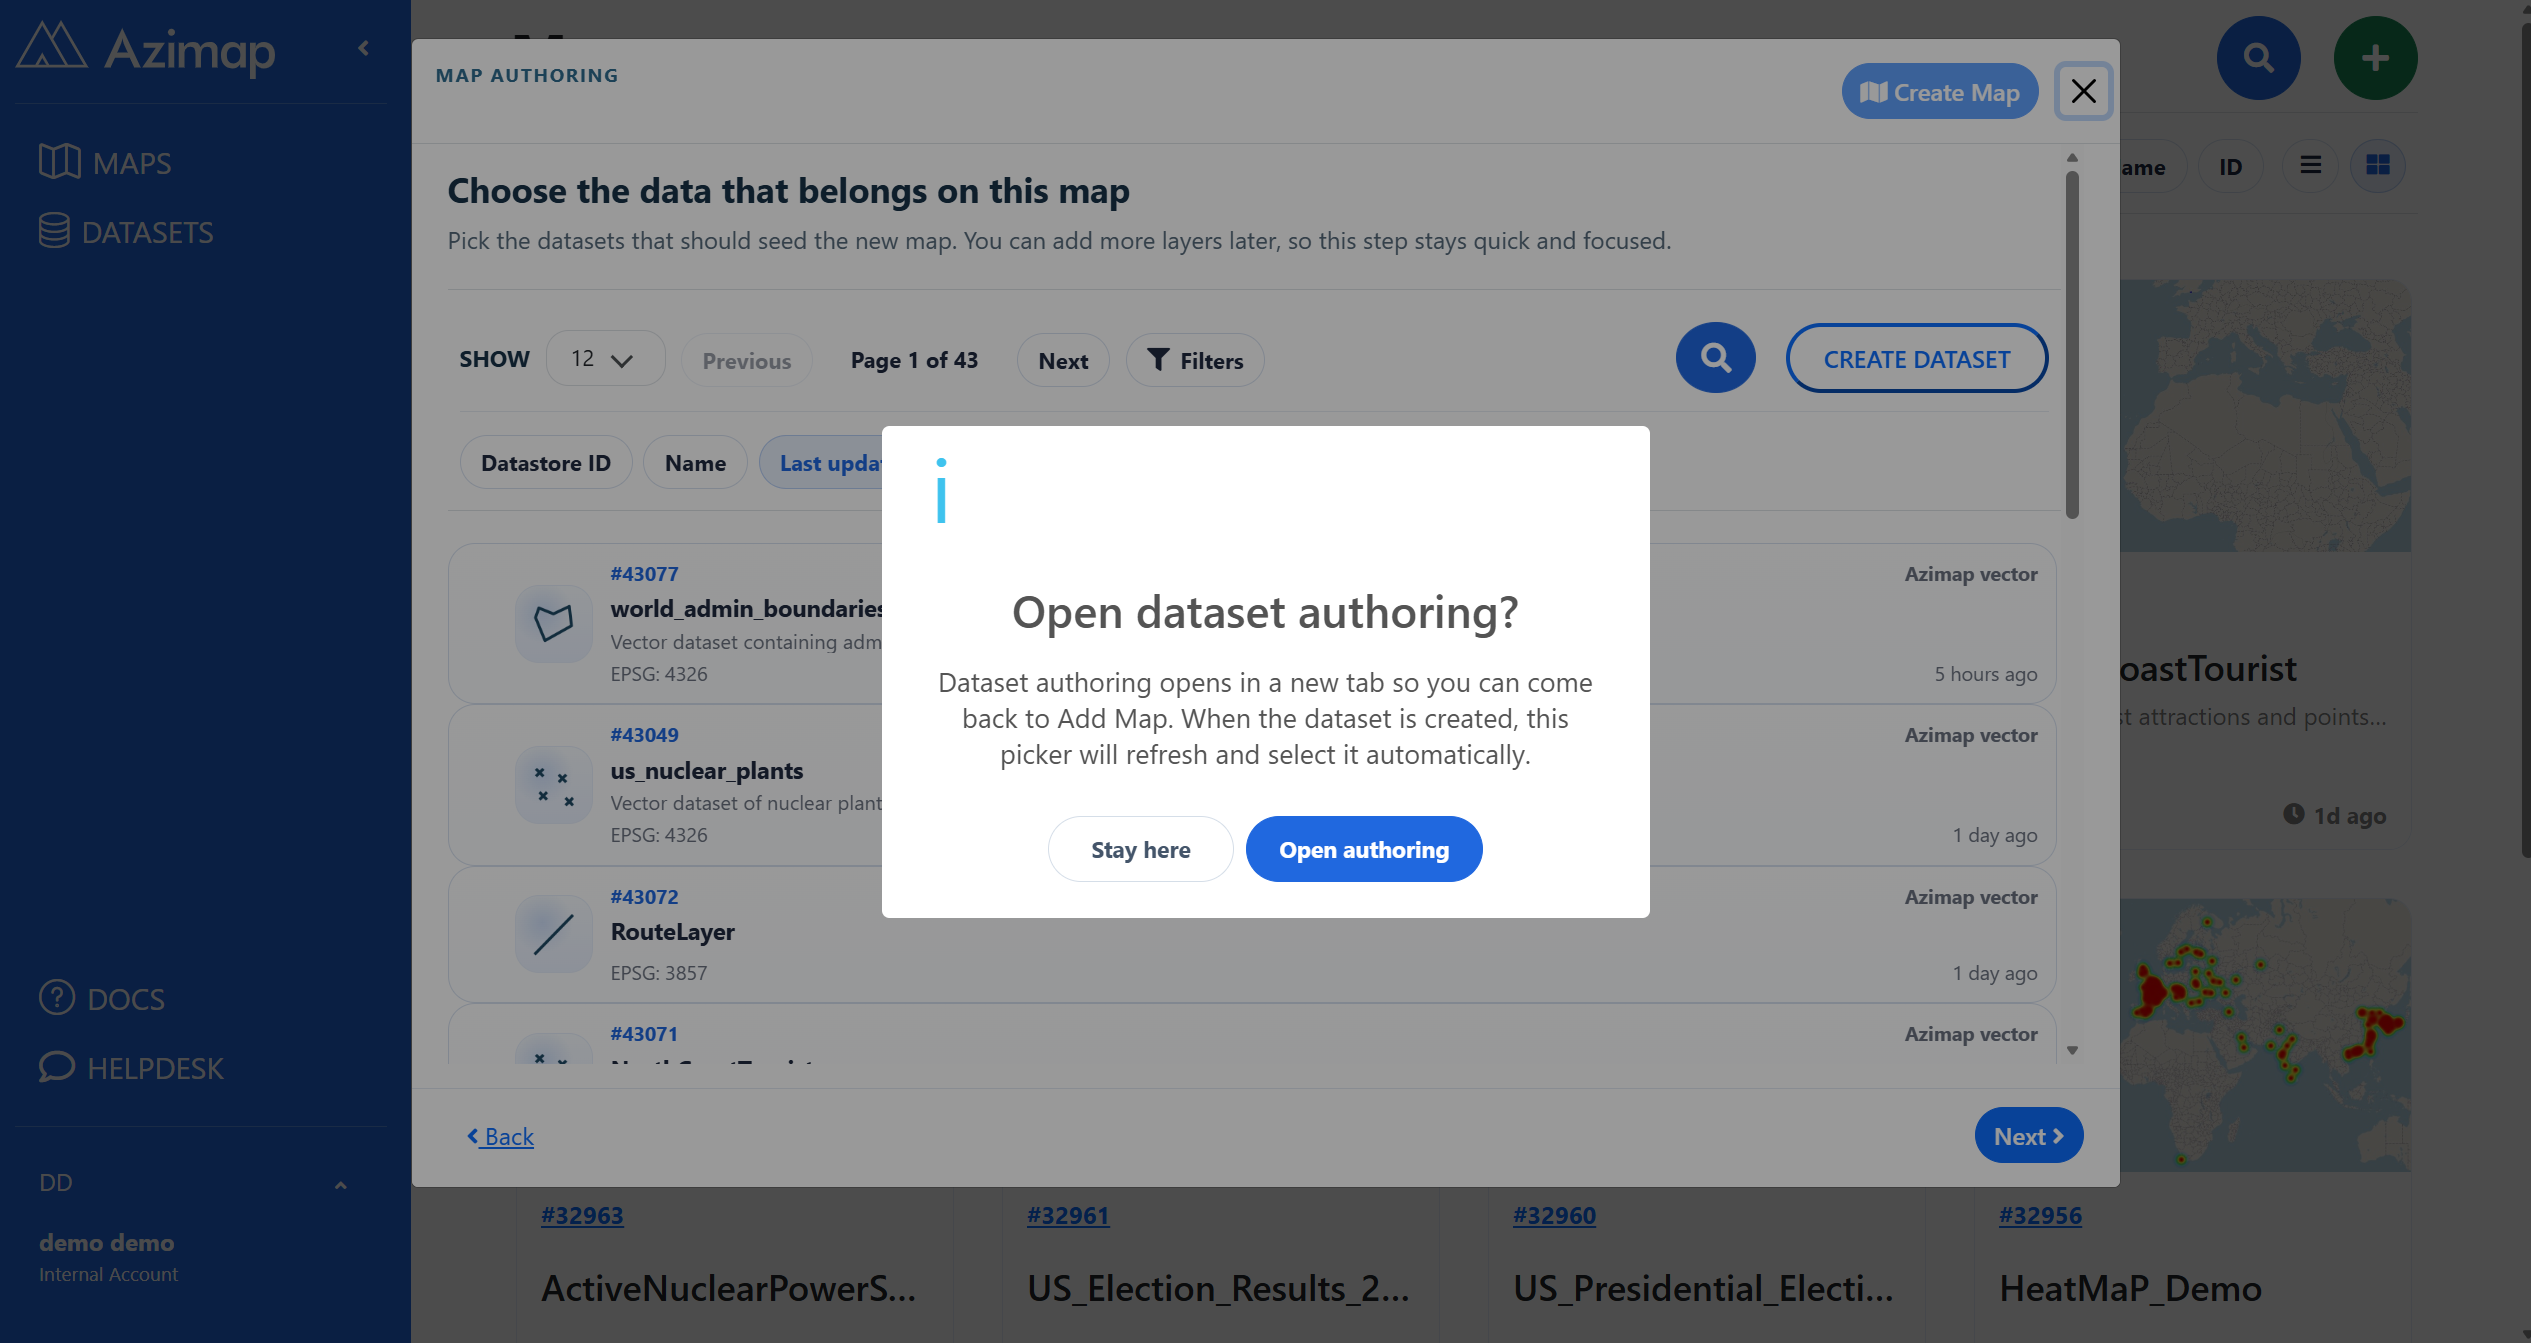
Click on "Open authoring". This will automatically bring you to
the first step of the CREATE DATASETS wizard.
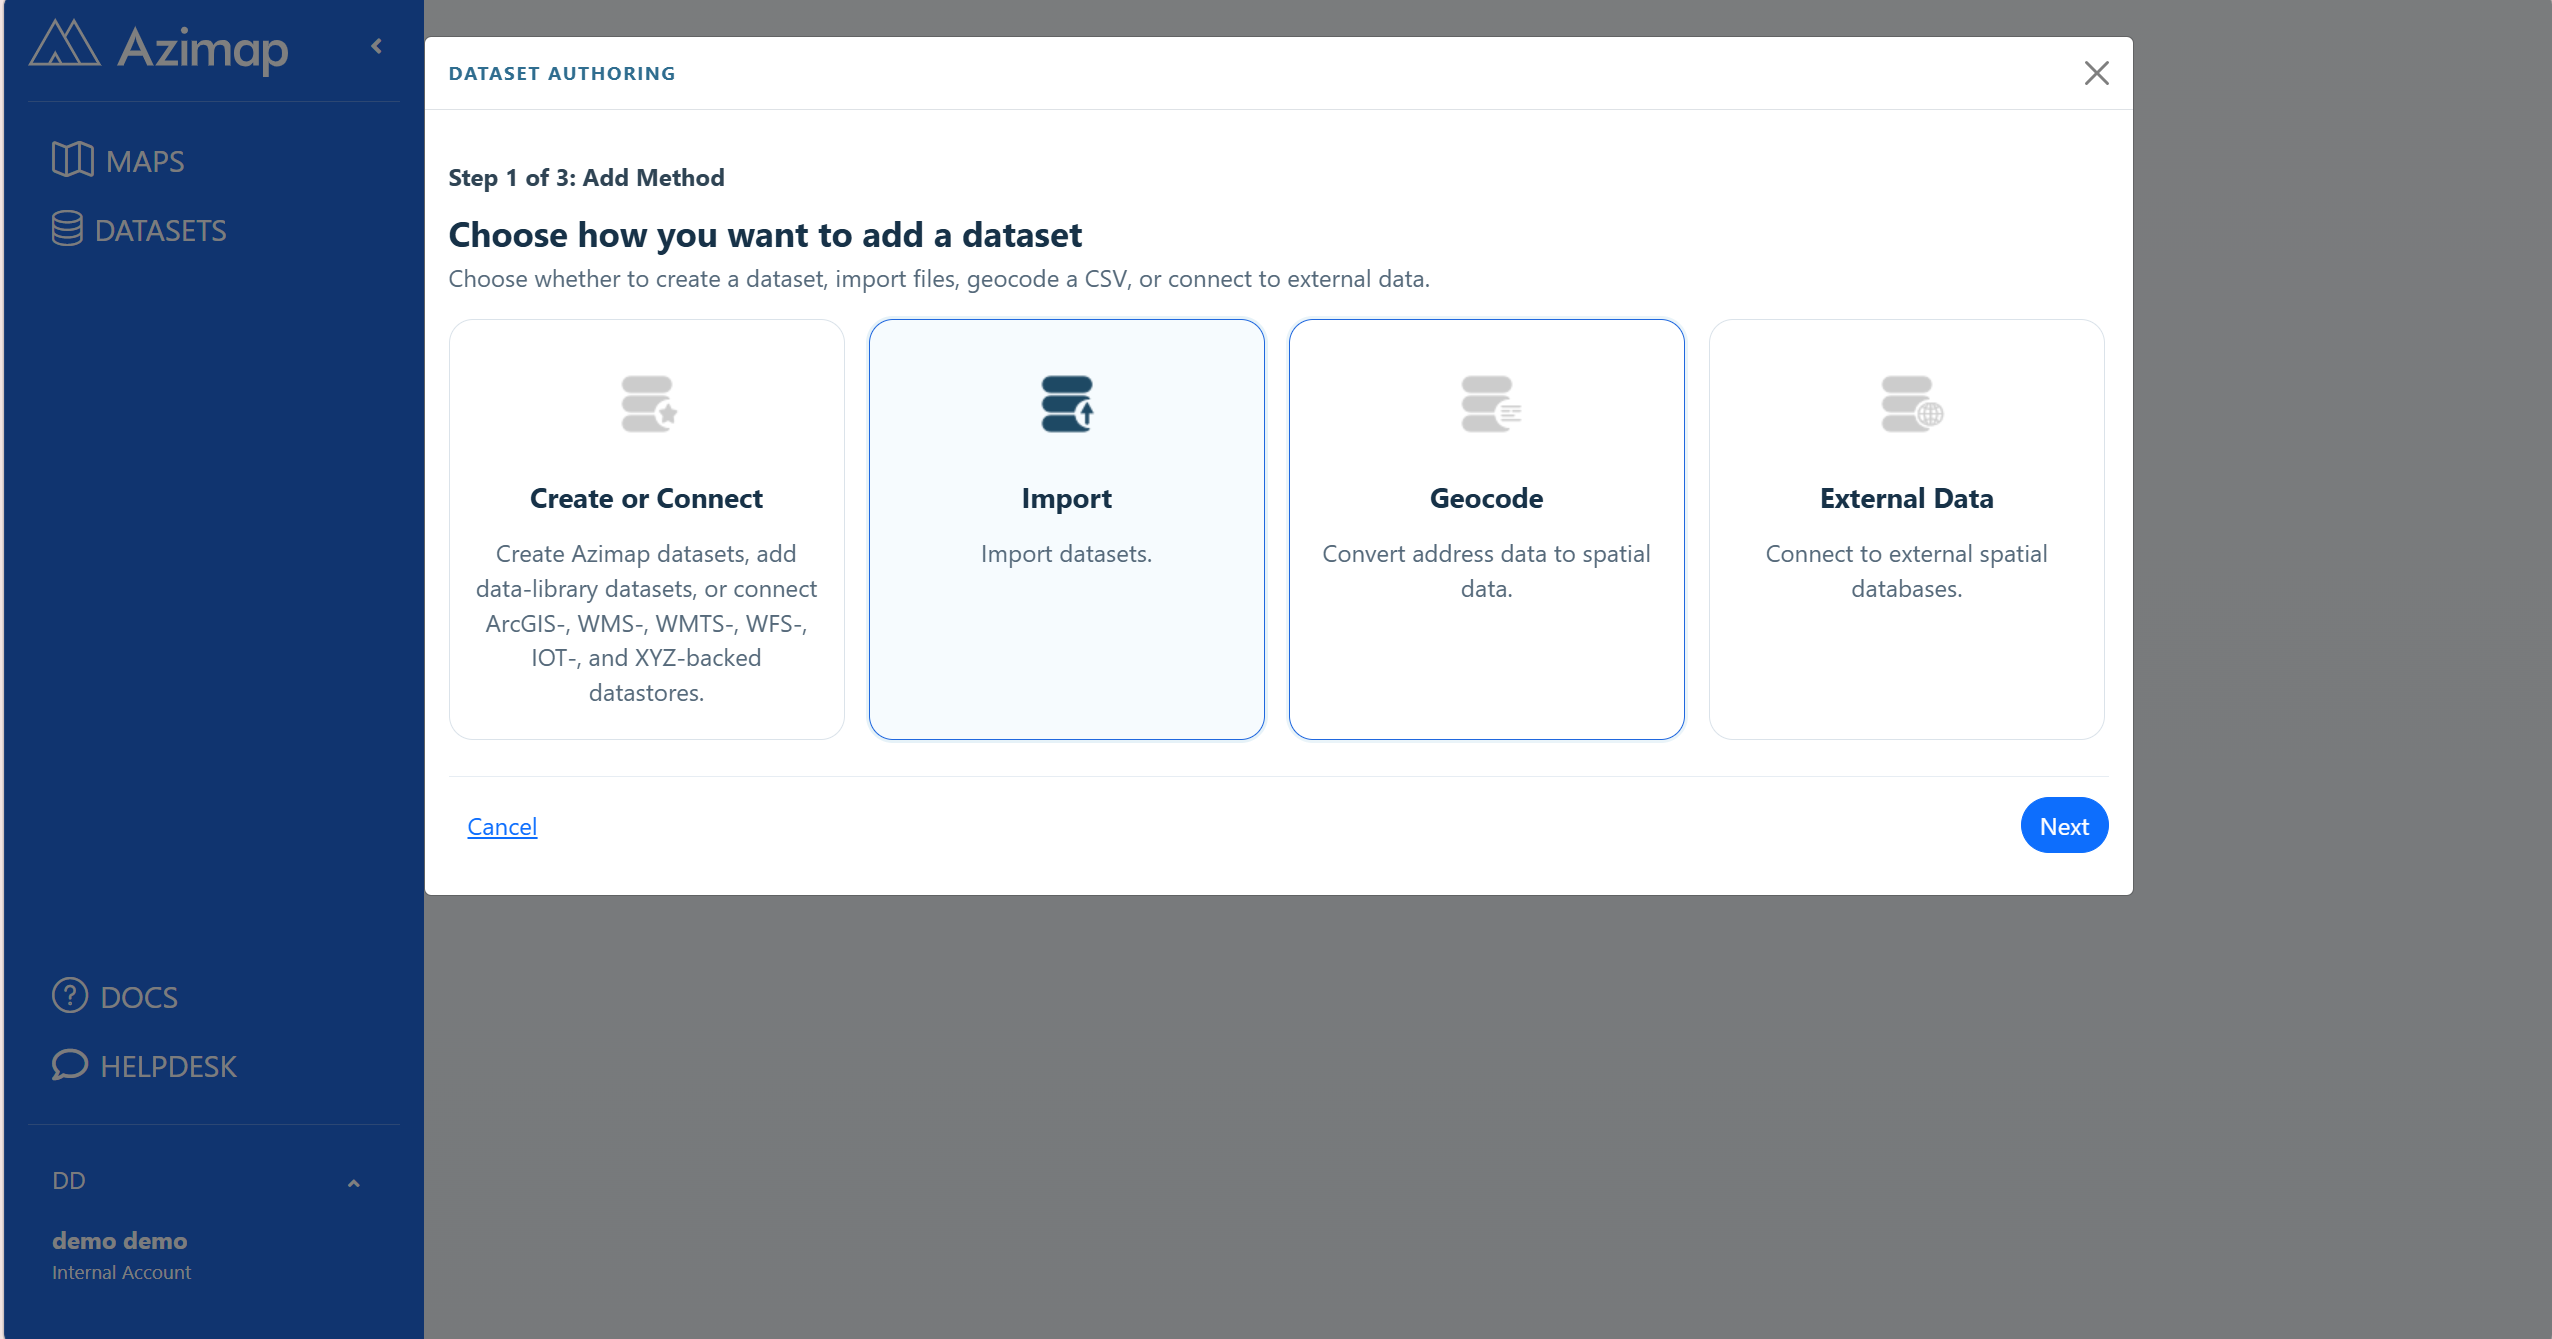
In the next step of the wizard,
you'll choose the IMPORT DATASETS option below.
·
Drag and drop earlier downloaded zip files (we
support zipped files or non-zipped).
·
After upload, the projection is automatically
chosen and a suggested name is added for each new layer based on the file name
(change this to any name you would like)
·
Click SAVE to import the datasets (this may take a few
seconds - the larger the datasets the longer it takes).
·
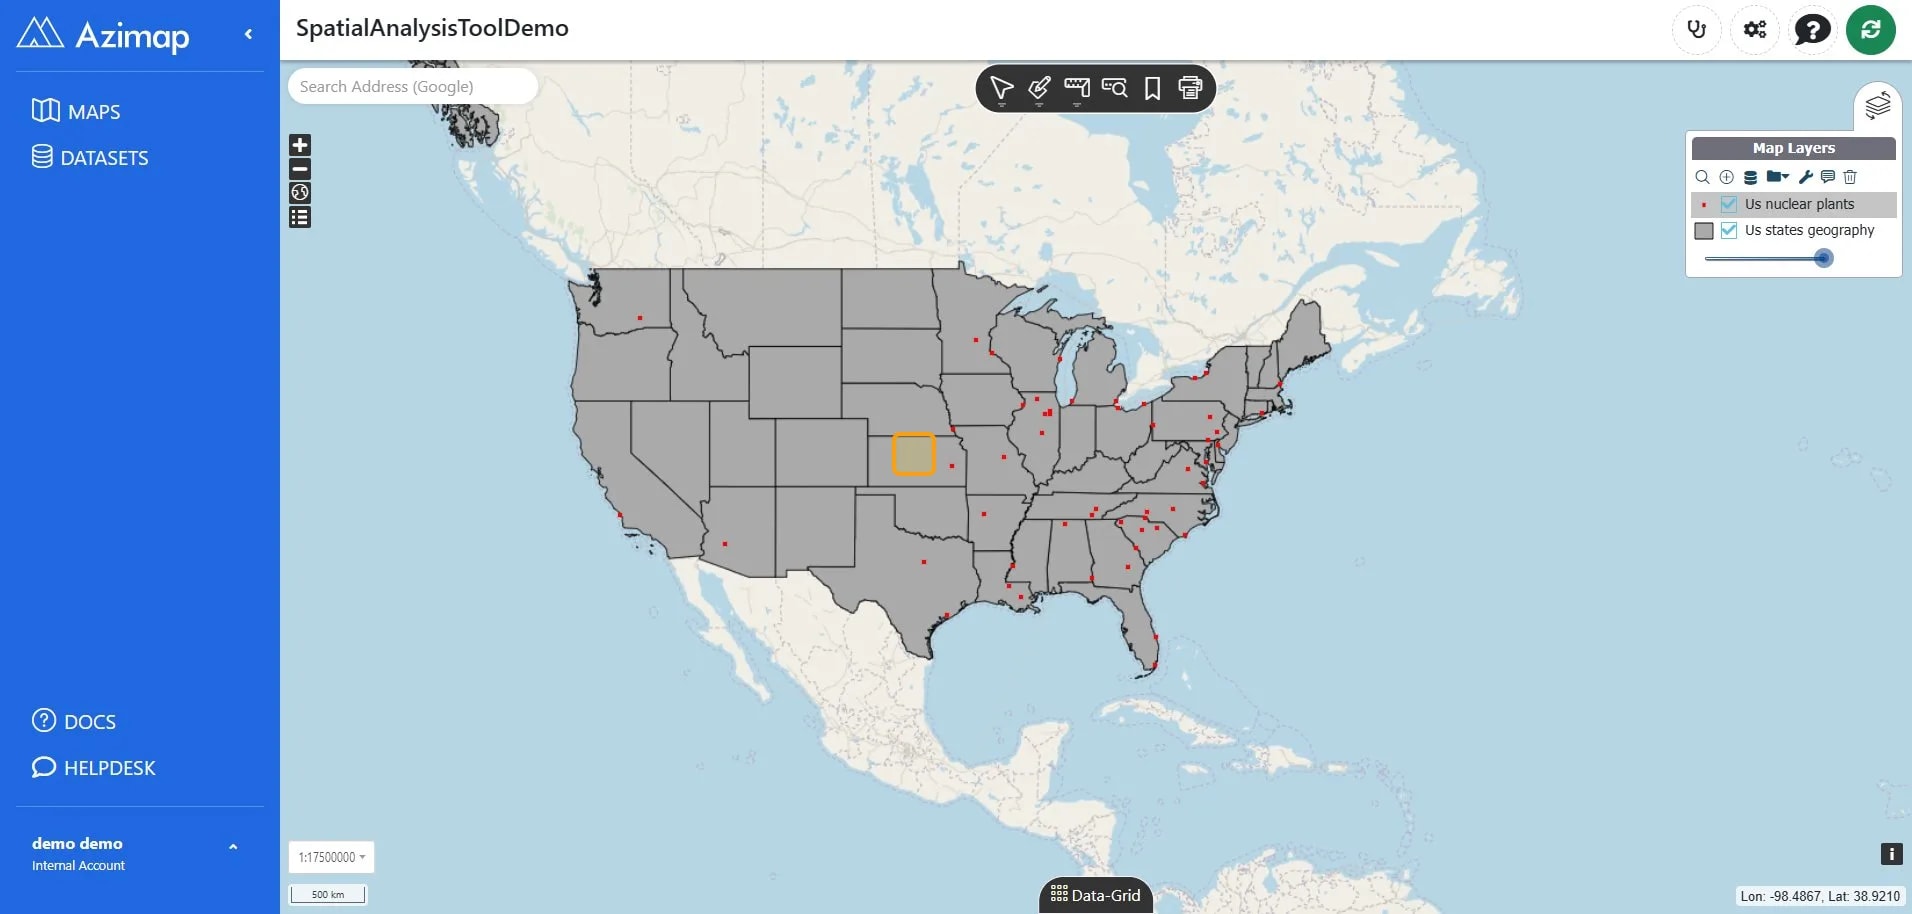
After successful import, the map will load with the
default styling (little red squares) and grey polygons.
2. Spatial analysis
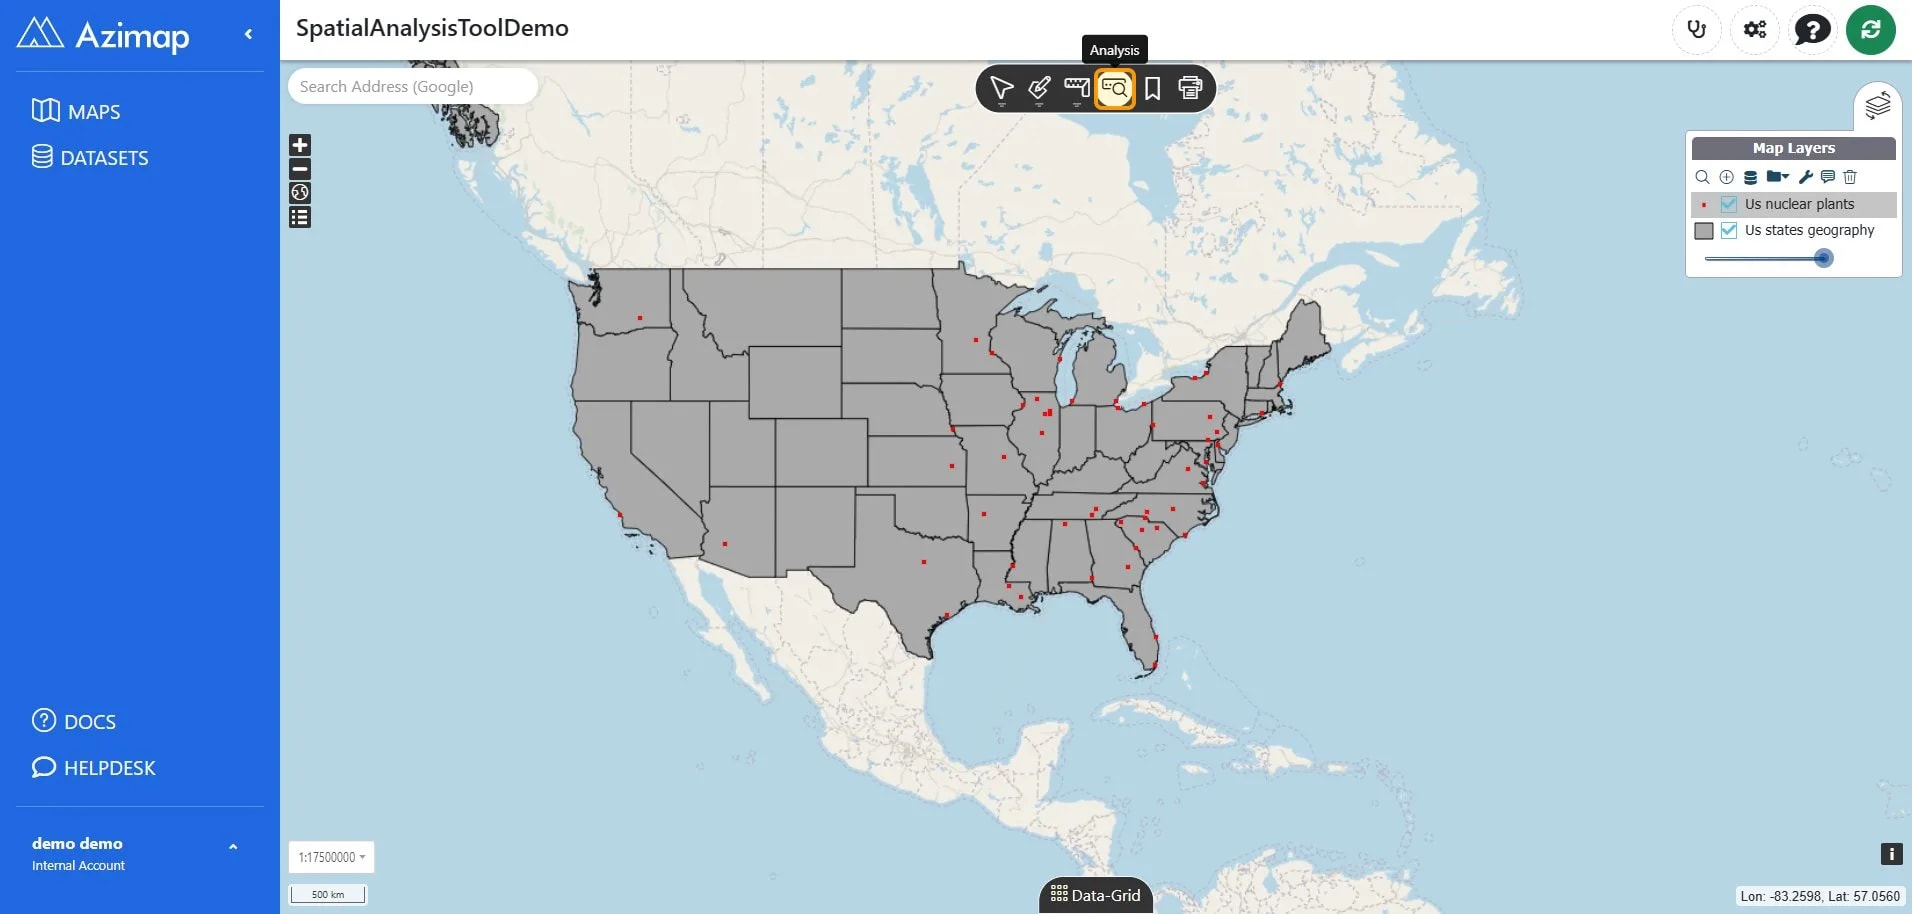
Click on the ANALYSIS button.
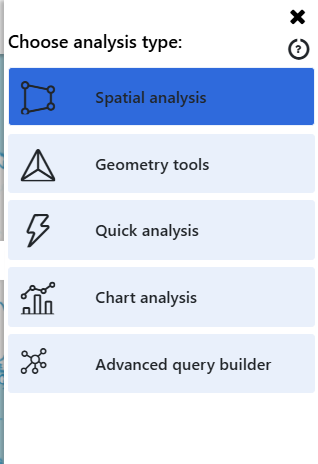
An Analysis sub-menu will appear where you can pick SPATIAL ANALYSIS.
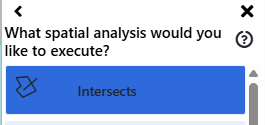
· The spatial analysis wizard will begin.
2.1. Functions of the spatial analysis wizard
2.1.1. Explanation of basic functions
This is a powerful wizard with multiple functions.
- Select layer - Choose the layer from which to get results
- Spatial function - 6 built-in spatial functions, as follows:
1. Intersects  Returns a result if two
geometries "spatially intersect in 2D" - (share any portion of
space).
Returns a result if two
geometries "spatially intersect in 2D" - (share any portion of
space).
2. Buffer  Returns results within a
given distance from the input geometry.
Returns results within a
given distance from the input geometry.
3. Overlaps  Returns a result if the
geometries share space, are of the same dimension, but are not completely
contained by each other.
Returns a result if the
geometries share space, are of the same dimension, but are not completely
contained by each other.
4. Within  Returns a result if the
geometry A is completely inside geometry B.
Returns a result if the
geometry A is completely inside geometry B.
5. Contains  Returns a result if and only
if no points of B lie in the exterior of A, and at least one point of the
interior of B lies in the interior of A.
Returns a result if and only
if no points of B lie in the exterior of A, and at least one point of the
interior of B lies in the interior of A.
6. Touches  Returns a result if the
geometries have at least one point in common, but their interiors do not
intersect.
Returns a result if the
geometries have at least one point in common, but their interiors do not
intersect.
Azimap utilises Postgis for its spatial analysis (Postgis Reference). Other functions can be utilised if entered directly into the query
window (further details below).
2.1.2. Explanation of advanced functions
·
Update radius - Distance for buffer (enabled on buffer analysis) options for
m, km and miles.
·
Geometry source –
o
 Select a
feature
Select a
feature
o
 Select
multiple features
Select
multiple features
o
 Compare layers
·
Secondary layer (enabled
on COMPARE LAYERS select) - When comparing layers,
choose the secondary layer to compare.
2.2. Basic and advanced functions in use
2.2.1. Intersects
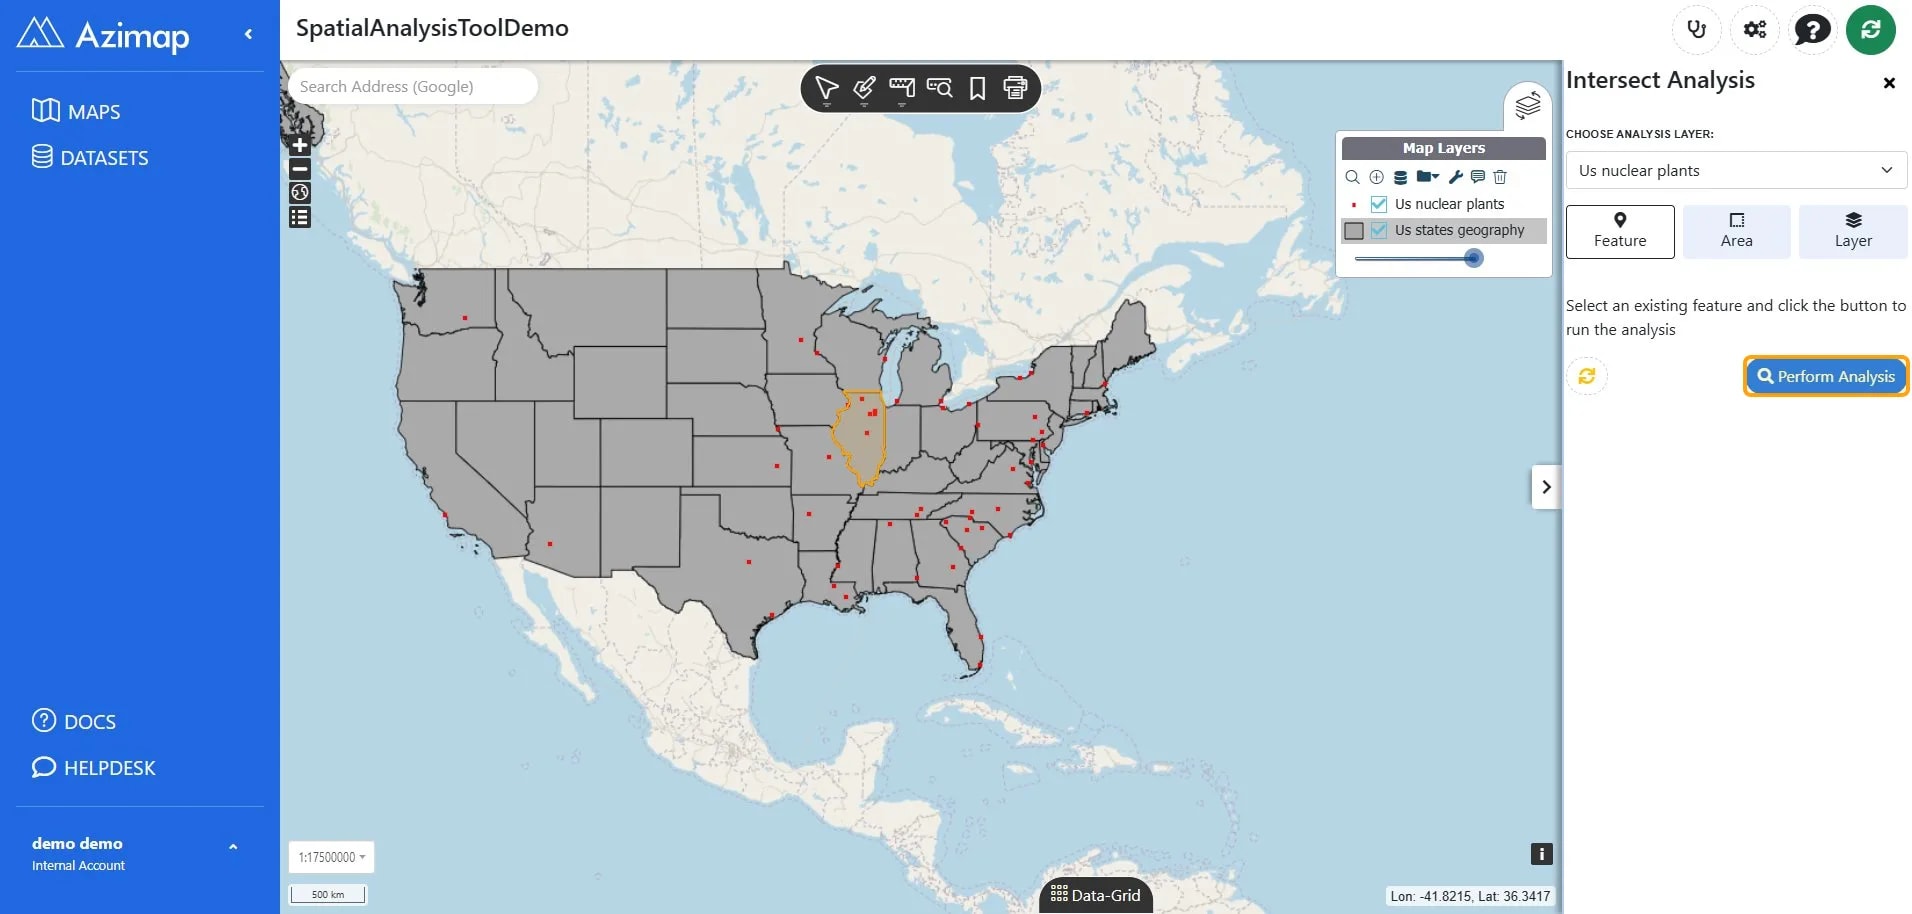
Let’s use the wizard to select all the nuclear stations that are in the state in Illinois in the United States of America.
a.
Click on the state Illinois to select the polygon
b.
Select OUTPUT
LAYER (NuclearReactors2011) in SELECT LAYER drop down
c.
Select INTERSECTS
TOOLS in SPATIAL FUNCTION choice
d.
Select the SELECT
A FEATURE tool
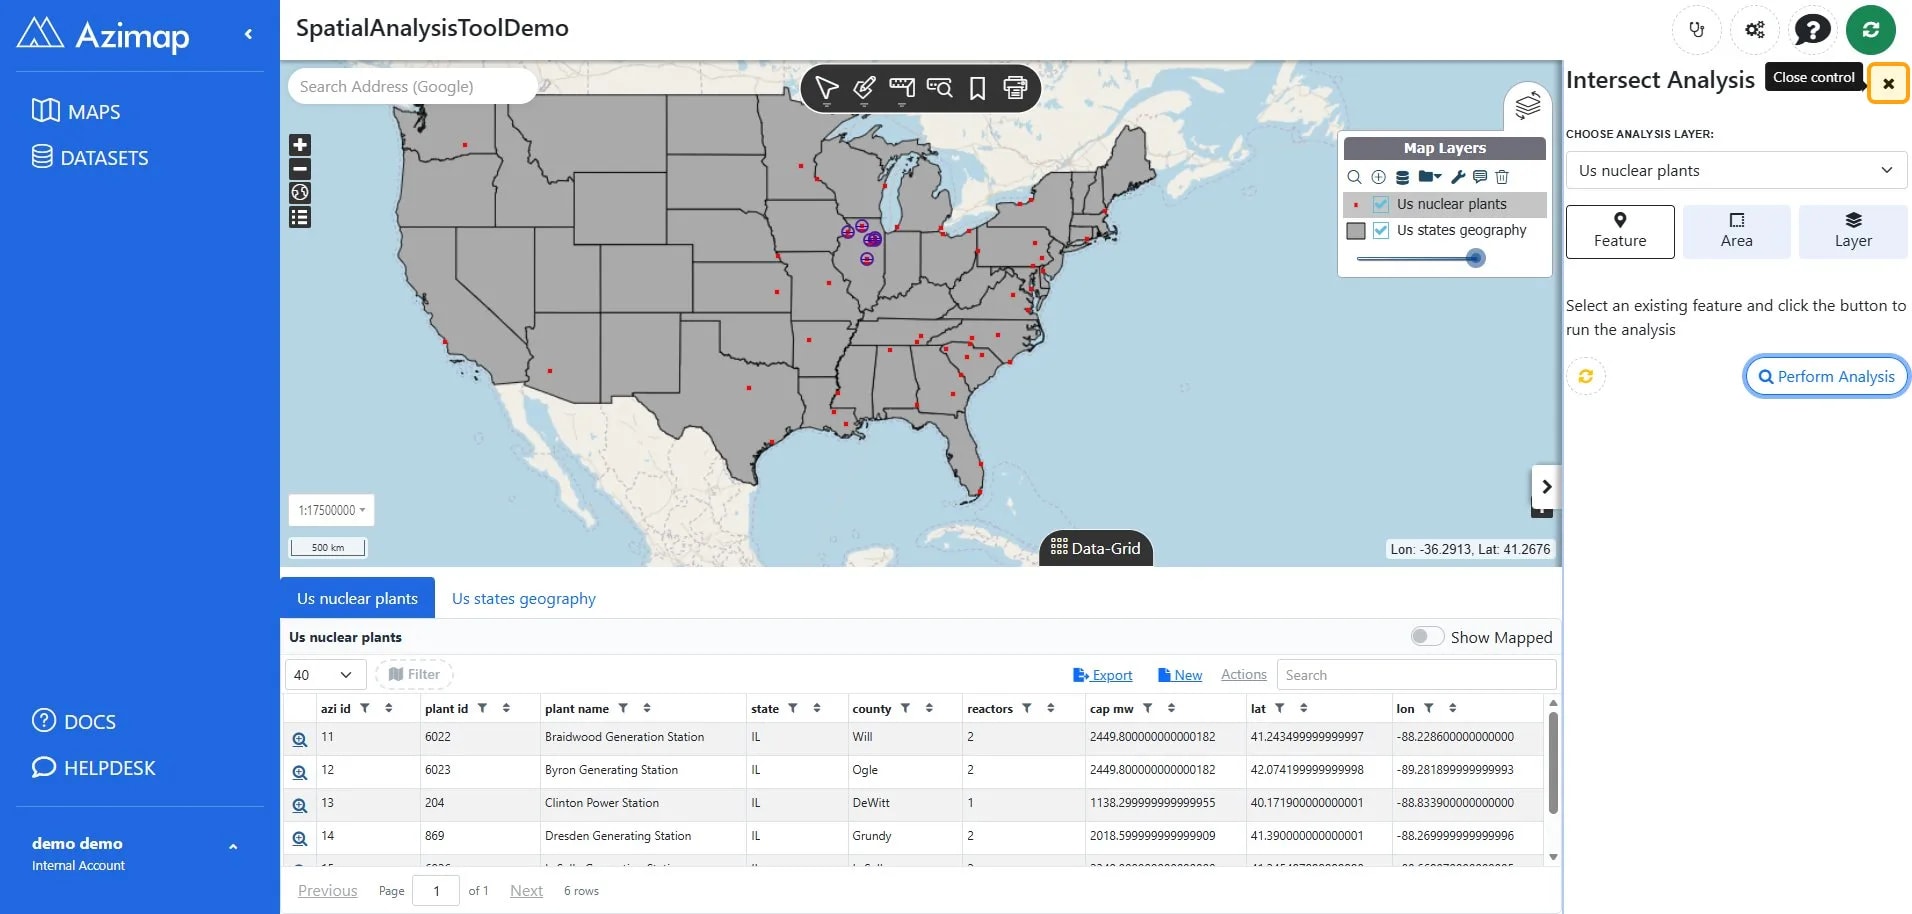
You can view the results in tabular format by clicking the Perform Analysis button

Click on Data Grid and it will show the filtered 6 power stations in Illinois.
1.
2.
2.1.
2.2.
2.2.1.
2.2.2. Overlaps, Within, Contains, Touches
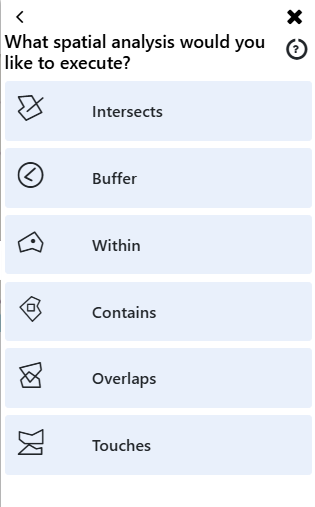
To perform any of the above spatial analysis just follow the process in step
2.2.1 but choose your applicable option from the SPATIAL FUNCTION section.
2.2.3. Buffer select
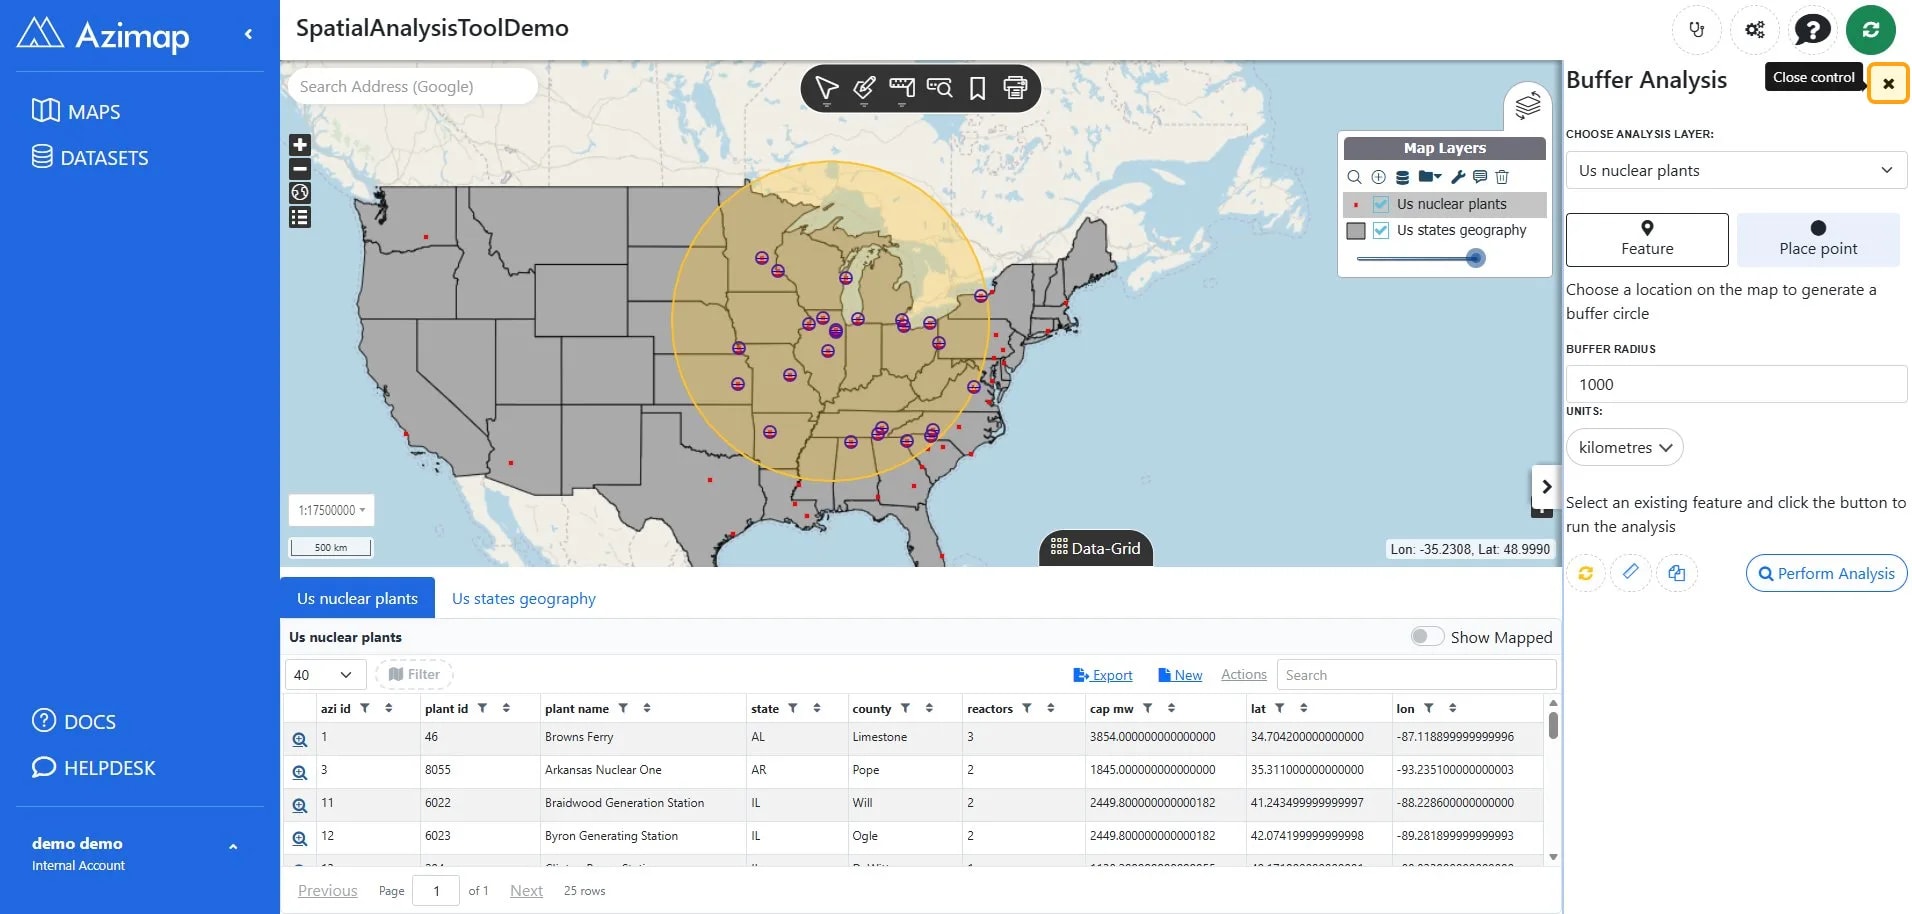
Creating selection buffers is slightly different - you must select the
radius of your buffer after choosing the BUFFER SELECT function.
Process the query as per step 2.2.1 only this time set a buffer radius
(will be enabled if BUFFER SELECT is chosen).
In this query we’ve selected a random power station in Illinios and set a
1000 Km buffer zone. The outcome is, the only the resulting answers being shown on the map.
2.2.4. Advanced SQL Query
The wizard can create query SQL for you.
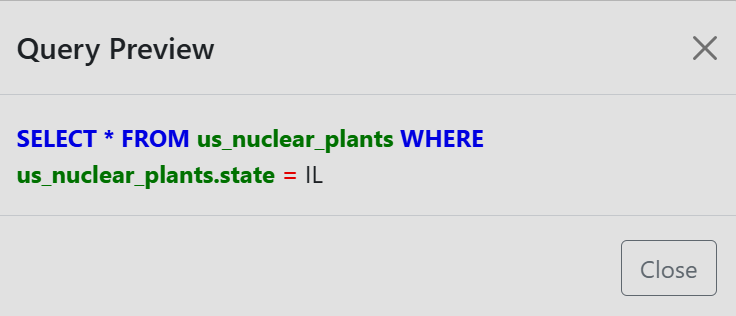
In the SQL query below we asking it to search again for only Nuclear Power Plants in the state of Illinios.
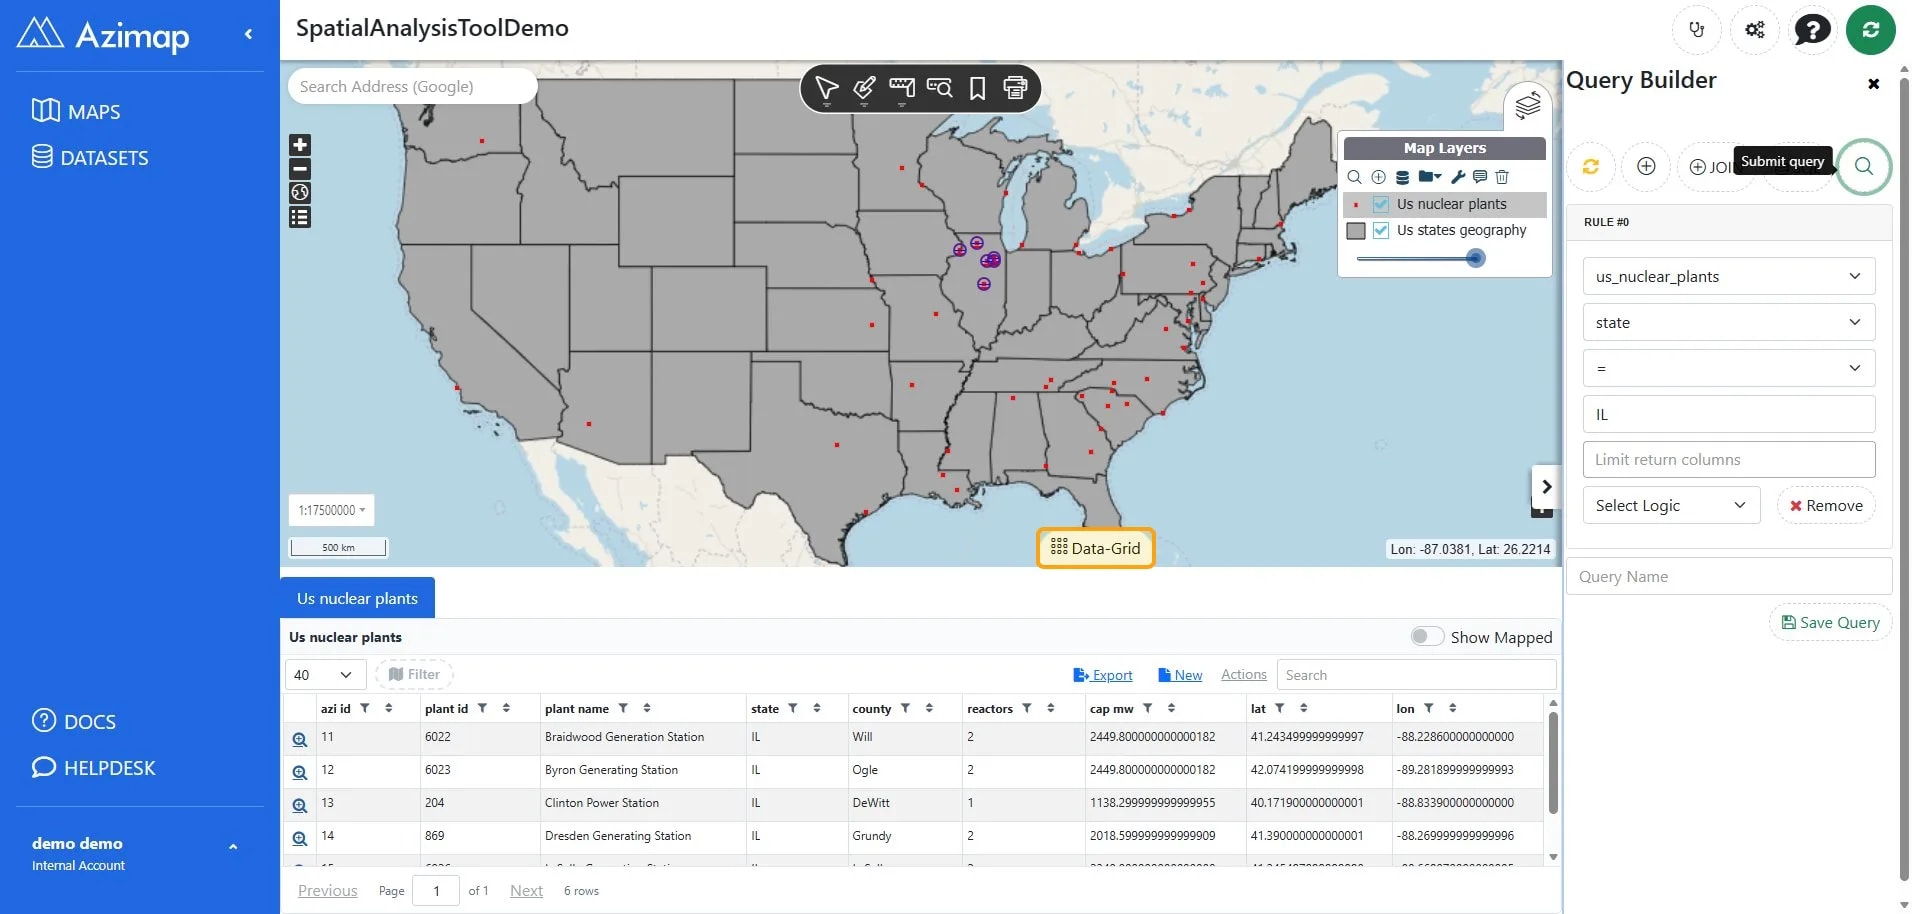
NOTE: Strings should be surrounded by single quotes. Double quotes are used by us to signify table
names and column names.
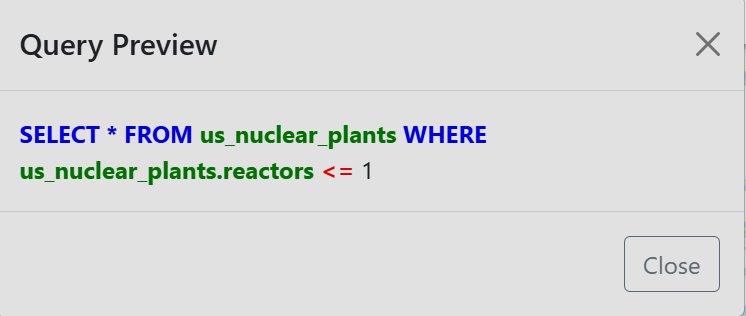
The SQL query also be used to search for power plants with only 1 Reactor.
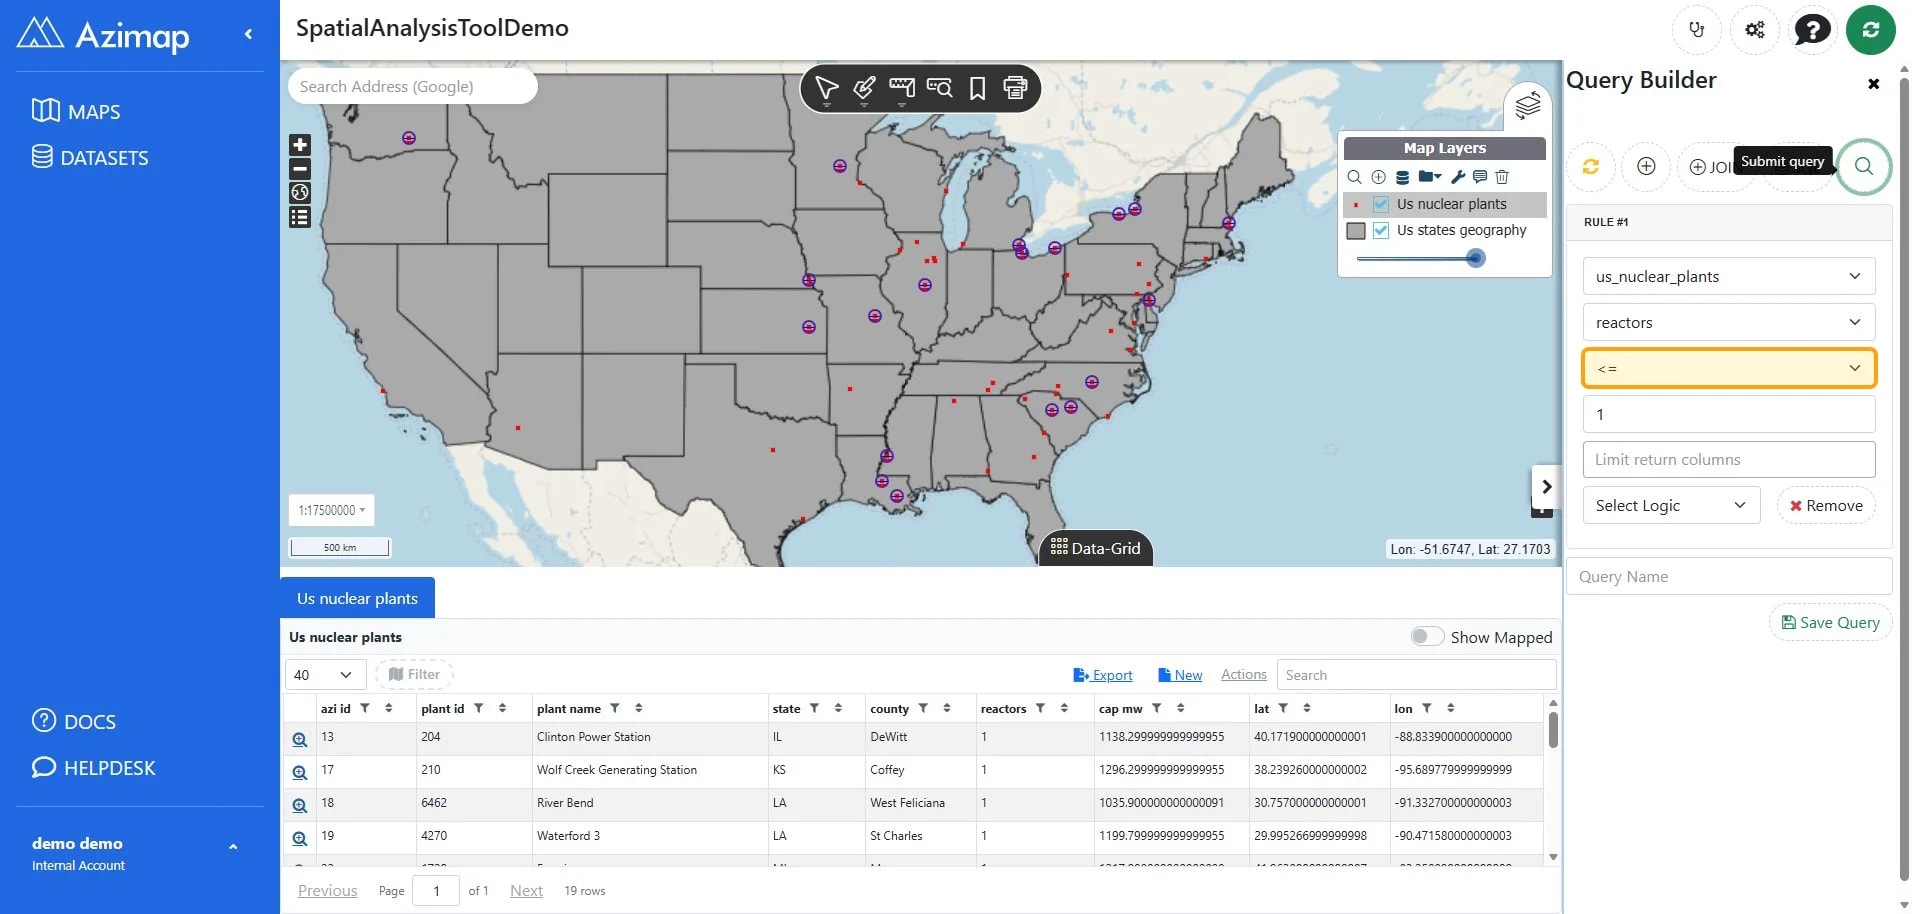
We can combine wizard generated queries with our own amendments also.
Thanks for reading the guide and we hope you get some great analysis
from your data.
If you haven't signed up yet go to the Azimap website and click REGISTER.
[1] US County Boundaries
Data source: U.S. Census Bureau – 2025 Cartographic Boundary Files
· Reuse: U.S. Government data; source citation recommended
· View Census boundary data
[2] US Nuclear Power Plants
Data source: U.S. Energy Information Administration (EIA)
·Reuse: U.S. Government public-domain data
· Attribution: Source: U.S. Energy Information Administration (June 2026).
· View EIA source data
View full data sources & licensing information