How to Join Two Layers
In this guide we’ll show you how to join two layers. To join 2 layers, your layers will need a
shared attribute.
We’ll
use a working example of US election data.
The zip file below contains a US counties Shape file and a CSV file
containing 206 US election results. The
datasets contain a shared column for fips county code, allowing them
to be joined into a new dataset by adding the data columns from the CSV to the
geometry data in the Shape file.
Time to complete: 20
mins.
Files required: Election data and US Counties Data**
Contents
1. Getting started
1.1 Create map
1.2 Download data
1.3 Import data onto your map
2. Join
your data
2.1 Using
the join data tool
2.2 Preview
joined data
2.3 Save
your new layer
3.
Style your new
layer (optional)
1. Getting started
1.1. Create map
Create New Map.
1.2. Download data
Download data
from Election data and US Counties Data.
The zip file
contains a US counties Shape file and a CSV file containing 206 US election
results. The datasets contain a shared
column for fips county code, allowing
them to be joined into a new dataset by adding the data columns from the CSV to
the geometry data in the Shape file. We have also included a CSVT file which
defines the format of the corresponding CSV columns. This will ensure the CSV columns are imported
with the correct data types. For more information on this see our CSV help page.
1.3. Import data onto
your map
Open your new map
and import the zip file. Follow these steps to complete this process:
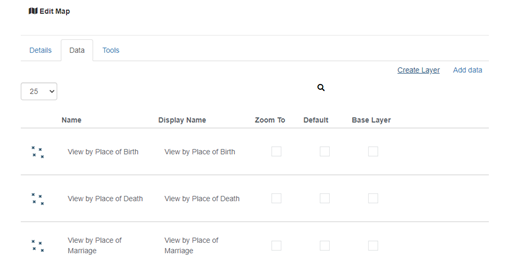
1. Click EDIT MAP CONFIG on the toolbar
2. Choose the DATA tab and click CREATE LAYER
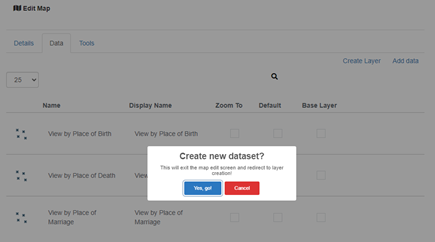
3. This will exit the map edit screen and redirect you to layer creation. Click YES, GO!
4. Create your layer as usual and import it onto the map.
2. Join your data
2.1. Using the 'Join Data' tool

Select the ANALYSIS button on the toolbar.
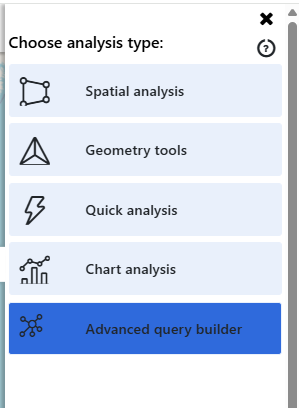
Select the ADVANCED QUERY BUILDER button.
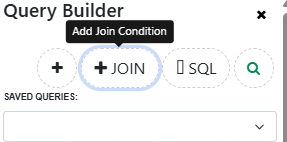
Select the JOIN DATA button and NEXT.
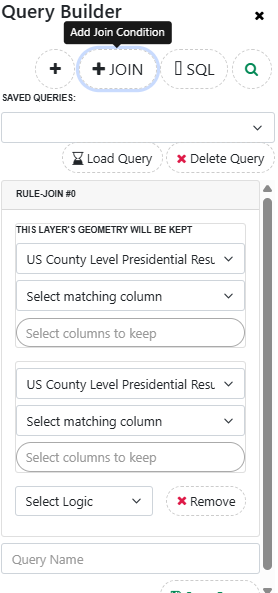
Our 'Join Data' tool will display as this when first selected. This tool has a few sections which we will explain in turn.
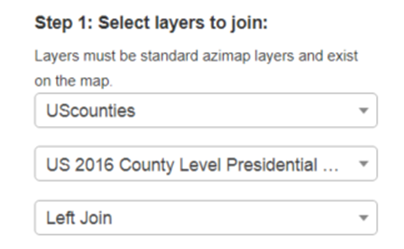
Initially you must
choose two layers on the map to join. Select "UScounties" as layer 1
and "US 2016 County Level Presidential Results" as layer 2.
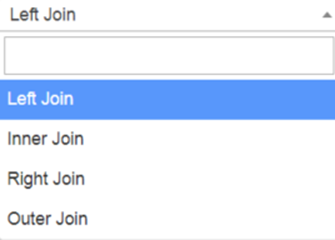
Available join
types are as above. See our join data options help page for
full explanations of each. For this dataset join we recommend LEFT JOIN.
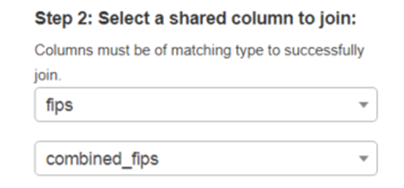
Select the columns
in each dataset that have matching data. Columns must have the same data type -
the type is displayed in icon format for each attribute. The join column for
layer 1 = "fips" and for layer 2 = "combined_fips"
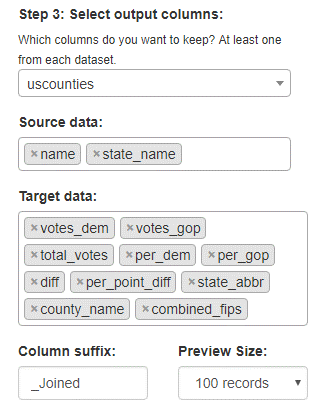
Choose which
dataset you would like to keep the geometry from. In this case only the US
counties dataset has a geometry so we chose it.
Choose columns to
keep for each layer, you must choose at least one from each layer.
Add a column suffix
to the second joined layer.
Set the preview
size, choices are 10, 100, 500. Default is 100 records.
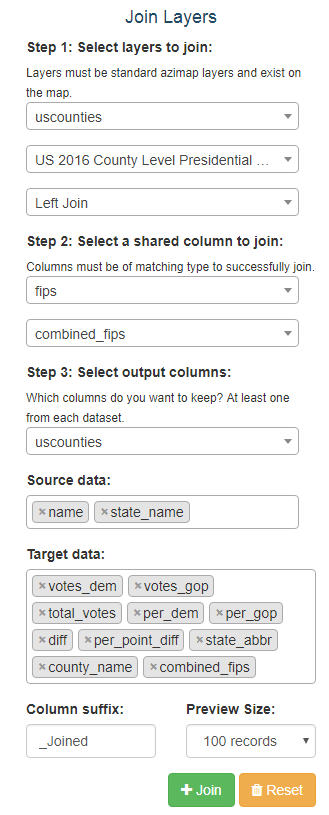
The fully ready to
join tool should look something like the above.
Click JOIN and wait a few seconds for results preview
2.2. Preview joined data
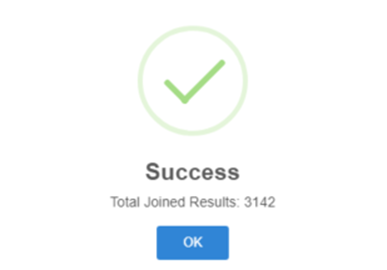
If the join is
successful you will get the above message with the total joined results.
2.3. Save your new layer
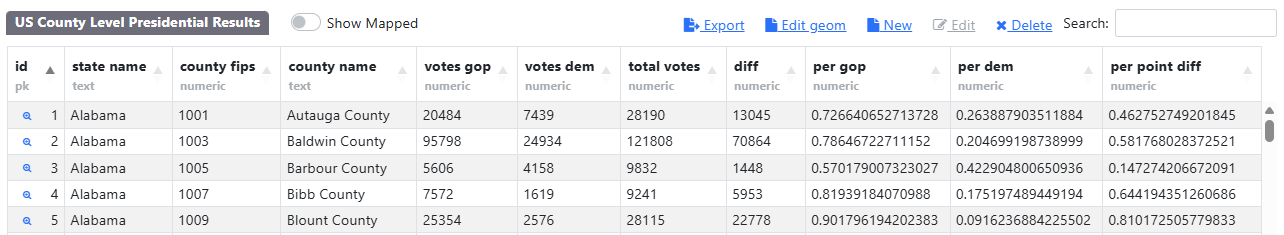
The preview data will display in data panel. At this point the join is purely temporary. To save the joined data click the SAVE AS A NEW LAYER button, at the top of the data panel.
Choose a name for
your new layer.
Click SAVE. Your
new layer will be imported and the map will refresh.
3. Style your new
layer (optional)
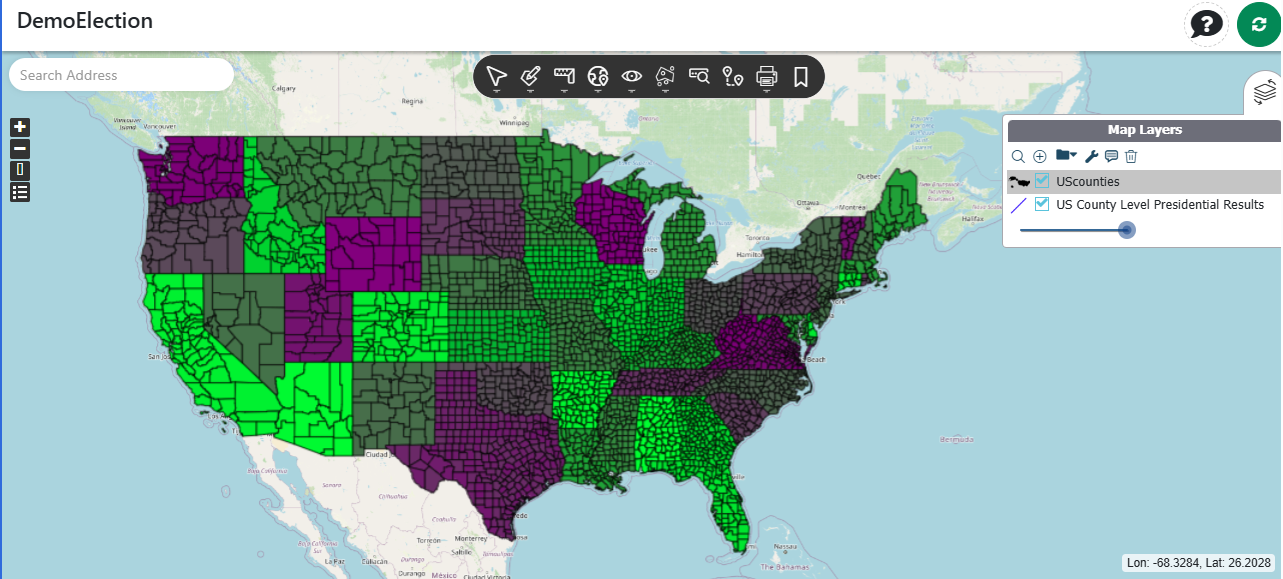
Style your layer to
make the most of the newly joined data. We styled a thematic map using the
"per point diff joined" column resulting in the following map.
For advice on how
to create a choropleth map please see our guide.
That's it - Your
data is joined.
If you haven't
signed up yet go to the Azimap website and
click REGISTER.
Enjoy joining your
data in the future and thanks for reading the guide.