Create a Predominance Map in Just
30 Minutes
A predominance map helps represent geographical patterns by
comparing multiple attributes (fields) from your data. By showing differences
in value between many attributes, we gain new insights about how data
might be grouped geographically.
In this guide we’ll show you how
to create a predominance map in Azimap.
We’ll use a working example, creating a map of election results in UK by
constituency.
Time to complete: 35 mins.
Tools required - LibreOffice Calc
(download before beginning), Azimap
Contents
1. Getting started
1.1 Download and extract files
1.2 Download LibreOffice Calc
2. Editing
the dataset
2.1 Add
attributes using LibreOffice Calc
2.1.1 Decide
on your new attributes
2.1.2 Define
column structure
2.1.3 Formula
for WINNER column
2.1.4 Formula
for NUMVOTES column
2.1.5 Formula
for PERCVOTES column
2.1.6 Final
edits to dataset
3.
Creating your
predominance map
3.1 Create a new map
3.2 Upload your data
3.3 Style your data
3.4 Set up layer interactivity
1. Getting started
1.1. Download and extract shape file
Download the following sample files: UK Elections Results 2015.zip [1] and extract the zip file to a folder.
1.2.
Download LibreOffice Calc
Download this software now if you
still need to. We’ll be using it to
create some extra attributes (columns) and perform some calculations on our
dataset.
2. Editing the dataset
2.1. Add attributes using LibreOffice
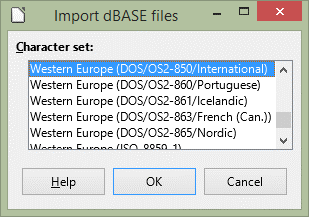
Open the .dbf file
"GB&NI_Election2015.dbf" with LibreOffice Calc.
Accept the default character set.
2.1.1.
Decide on your new attributes
We’re going to add three new
columns (attributes) to the .dbf file.
This is because while we have all the raw data, we want to use the data
to create attributes (columns) that will translate easily onto a map.
In this case, we’re going to
create the following columns:
- Winner - the resultant
elected party
- NumVotes - the number of
votes the winner achieved
- PercVotes - the percentage
of the votes cast the winner achieved
2.1.2.
Define column structure
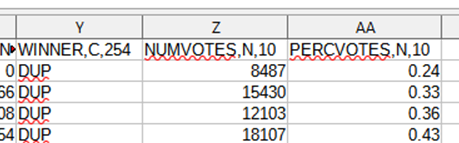
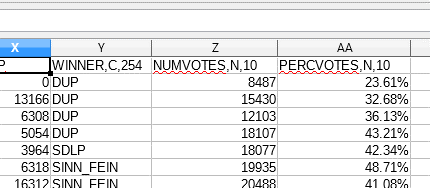
We now need to define the column
structure, so each new column header should be set as:
WINNER,C,254 - varchar, 254 characters
NUMVOTES,N,10 - number 10 digits
PERCVOTES,N,10 - number 10 digits
Your new column headers will look
something like this:
NB. Care must be taken that the
data inserted in the created columns matches the above structure.
2.1.3.
Formula for WINNER column
In the WINNER column
ROW 2, use the formula:
=INDEX(I1:X1,0,MATCH(MAX(I2:X2),I2:X2,0))
Here we are trying to return the
column header to the cell of the highest value in the range. To do this we
can apply a combination of INDEX, MATCH and MAX functions to get the
result.
We want to make the index range
static rather than relative for this so select the first:
and press F4 which will make it
static, like this:
=INDEX($I$1:$X$1,0,MATCH(MAX(I2:X2),I2:X2,0))
2.1.4.
Formula for NUMVOTES column
In the NUMVOTES column ROW
2 use the formula:
This will select the highest
number in the range.
2.1.5.
Formula for PERCVOTES column
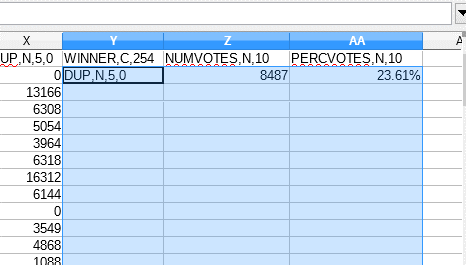
In the PERCVOTES column ROW
2 use the formula
Right-click on the PERCVOTES
column and choose FORMAT CELLS. Set the
column category to PERCENT and click OK.
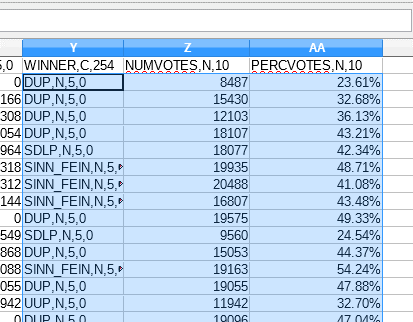
Next, select all rows in the
three new columns, except the headers.
Use CTRL-D to copy the formula
from the 1st row selected into all the other rows.
2.1.6.
Final edits to dataset
We’re nearly finished with the
data work! As you can see from the above
screenshot, unfortunately LibreOffice Calc copies the structure information of
the header into the winner column. To solve this, delete the structure data
from the applicable header cells (don't worry this is only visual).
Change your headers from this:

To this:

Result:
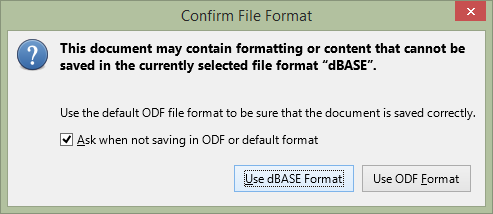
Save your amended file as a dBASE
file (default)
That's it, all data preparation is
complete – now let's make a map.
3. Creating your predominance map
3.1. Create a new map
Click on MAPS section and select
CREATE MAP.
This will open up the first page of the
map creation wizard.
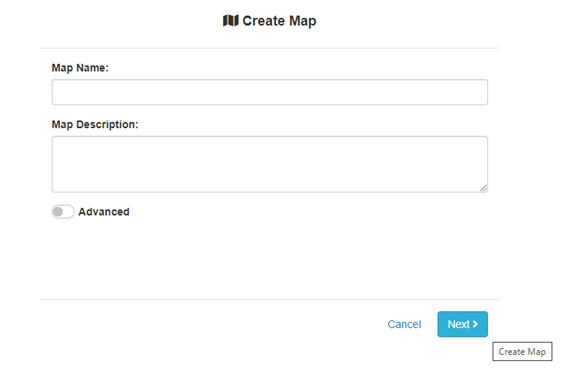
Name your new map and select NEXT.
3.2.
Import data and add to map
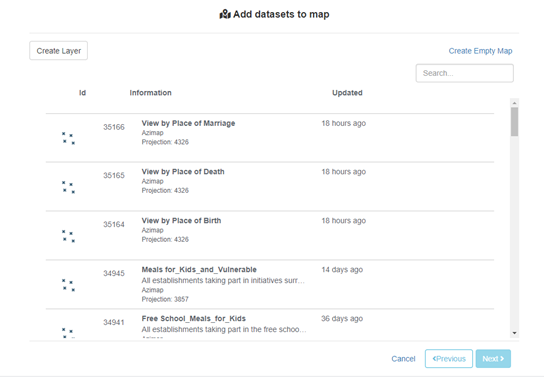
At this stage you have a number of
options. You can create a brand new layer for your map by selecting the CREATE
LAYER button. Alternatively you can choose to upload one or many of your
existing layers onto your map (your full list of layers will appear), or you
choose to create an empty map.
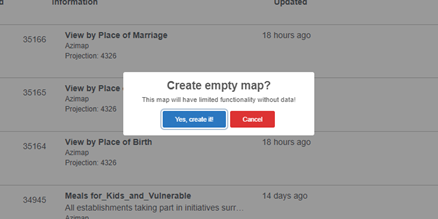
When you try to load a map without
any layers attached you will get the below warning.
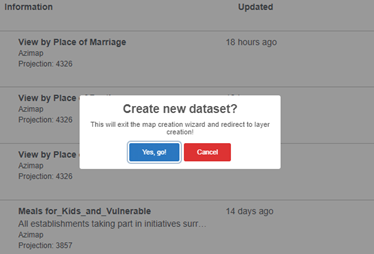
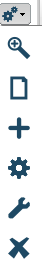
In this case however, we'll choose
the CREATE LAYER button (this is also accessible on the map using the gears
button on the layer tree view). You'll be prompted with the below
pop-up. Select YES, GO.
Re-zip the shape file (as it’s quicker to upload) and drag and drop to upload.
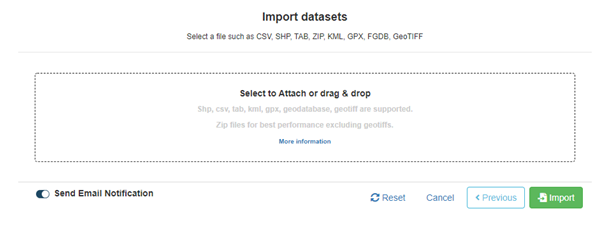
Rename your layers after upload if you desire (upload may take a little
while depending on internet speed).
Click SAVE to import (should take around a minute)
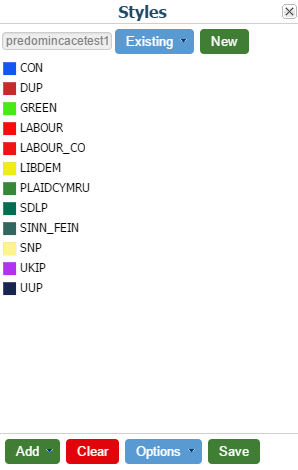
3.3.
Style your data
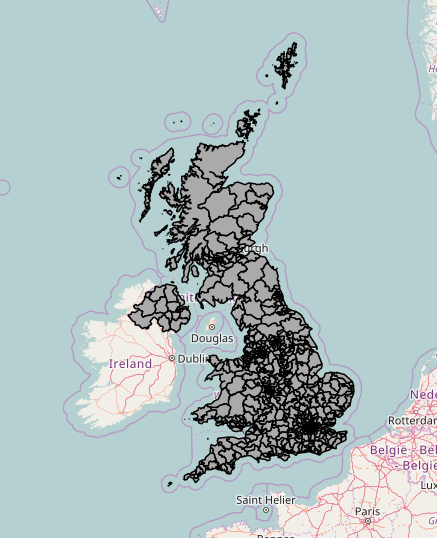
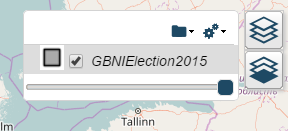
The layer will load with the default polygon layer style (black outline,
grey polygon).
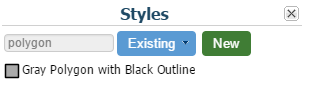
Click on the style preview icon next to the layer name in the layer
chooser to modify the style.
Click NEW to create new style.
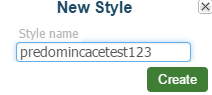
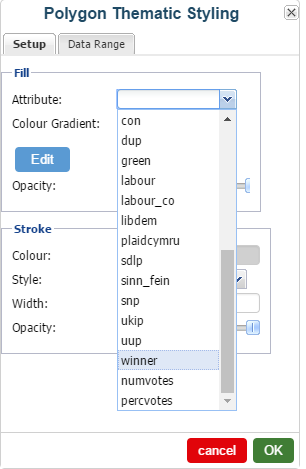
Click ADD and choose the POLYGON THEMATIC STYLING wizard.
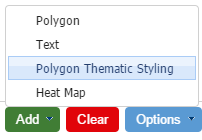
Select the attribute you want to style against - for this map we will
use the earlier created column "Winner".
Change the style options as you see fit - I have set stroke width to 0.1
and stroke opacity to 50%.
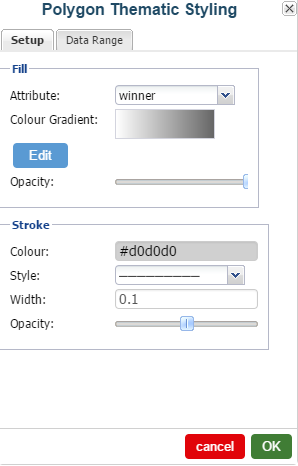
Next, click on the 2nd tab DATA RANGE to set the colours for your
autogen style.
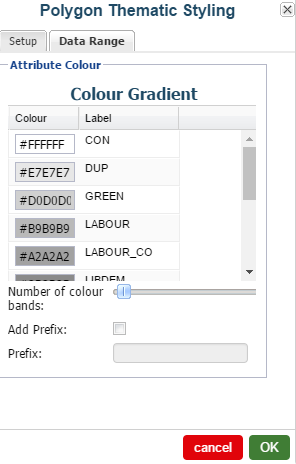
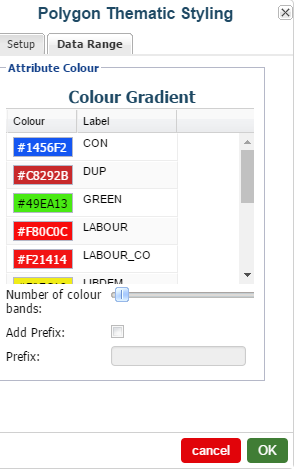
Click on the colour or enter your hex code to set to your desired colours.
After you have entered your desired colours, click OK to exit.
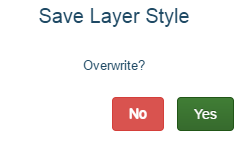
If you’re happy with the style, click SAVE. Click YES to save as current
style or NO to give the style a new name.
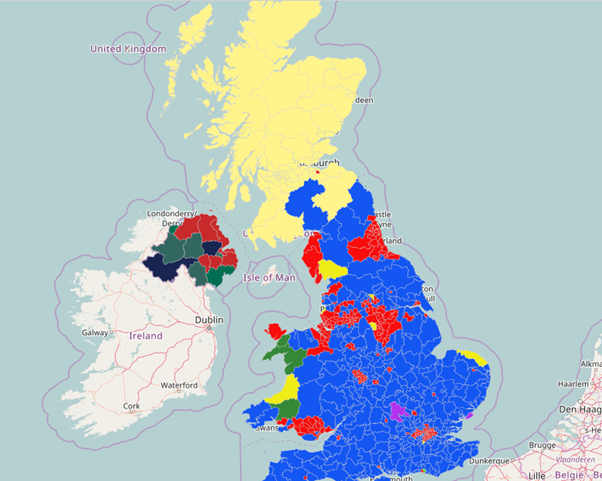
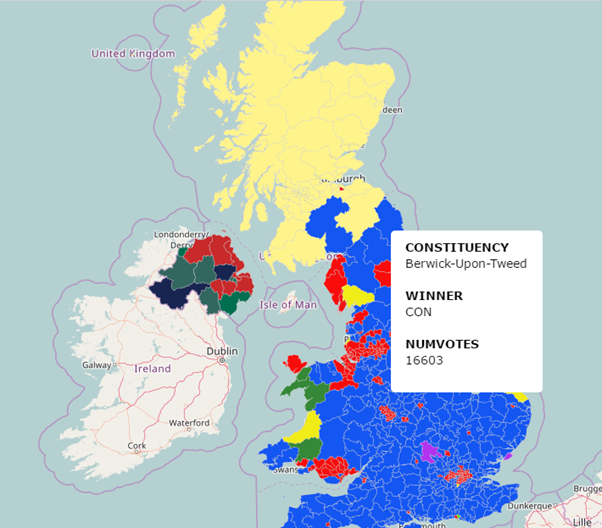
This will reload the layer with the new style and should look like below. Well done you've got a predominance map!
3.4.
Set up layer interactivity (optional)
Azimap has the capability to add client-side interactivity to a map
layer utilising UTFgrid. Just choose
the data you want to show on hover, and it will display on the map immediately.
Select the edit map layer config button in the layer chooser control
(the gear symbol).
This will open the map layer config. control.
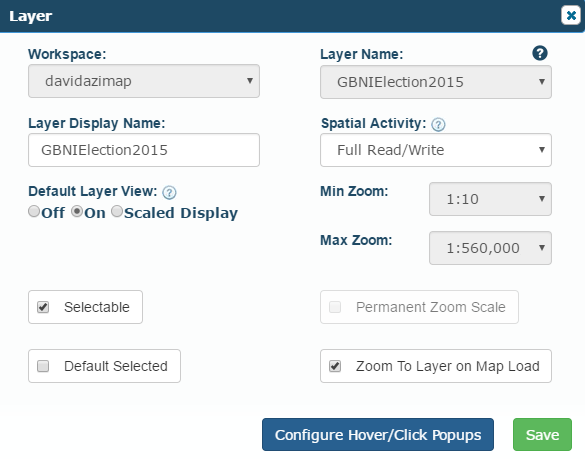
For this map click the CONFIGURE HOVER/CLICK POPUPS button.
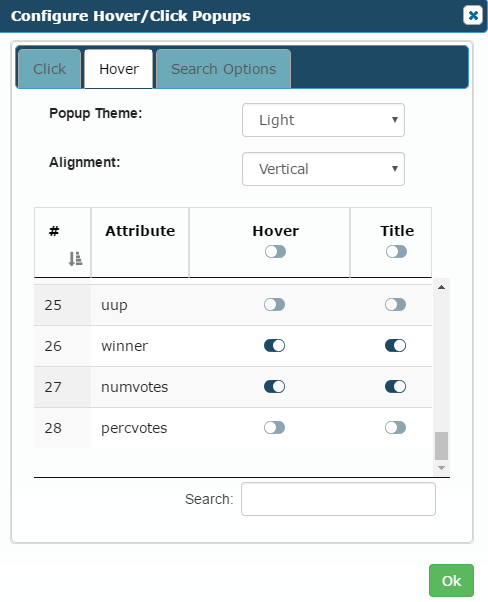
Select the 2nd tab HOVER - here we can choose the styling of our
interactive popup (black theme/ white theme or data layout of horizontal or
vertical).
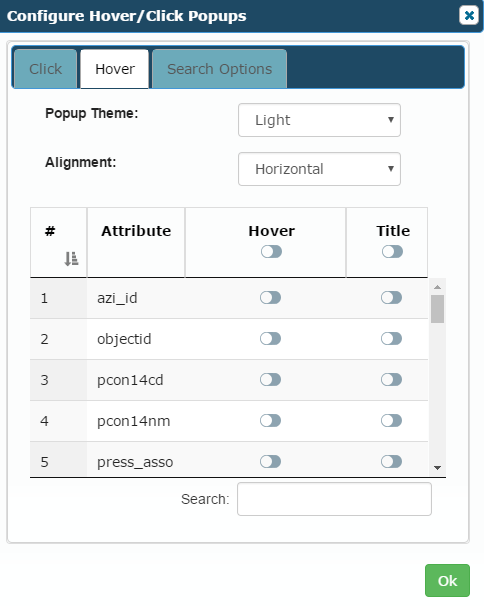
Choose the switch for the data you want to display in your interactive
hover popup - I have chosen CONSTITUENCY, WINNER and NUMVOTES. Click OK and
then Click SAVE.
Now to see your new interactive popup, hover over any polygon.
Thanks for reading the guide and we hope you enjoy creating predominance
maps with Azimap.
If you haven't signed up yet go to the Azimap website and
click REGISTER.