Written by:
Naimh
Last updated: 11/08/2026 14:41:46

This workflow guides users through generating and editing an election dashboard using AI, customizing visualizations, and saving the draft.

1

Click the 'Report dashboards' button to proceed with generating a dashboard.

Click the 'Report dashboards' button to proceed with generating a dashboard.
2

Click the 'Generate dashboard with AI' button to create a dashboard.

Button labeled 'Generate dashboard with AI' for creating a dashboard using AI.
3

Resize widgets by selecting and moving from bottom right corner.

Click the 'Edit Map' button to modify the map widget.
4

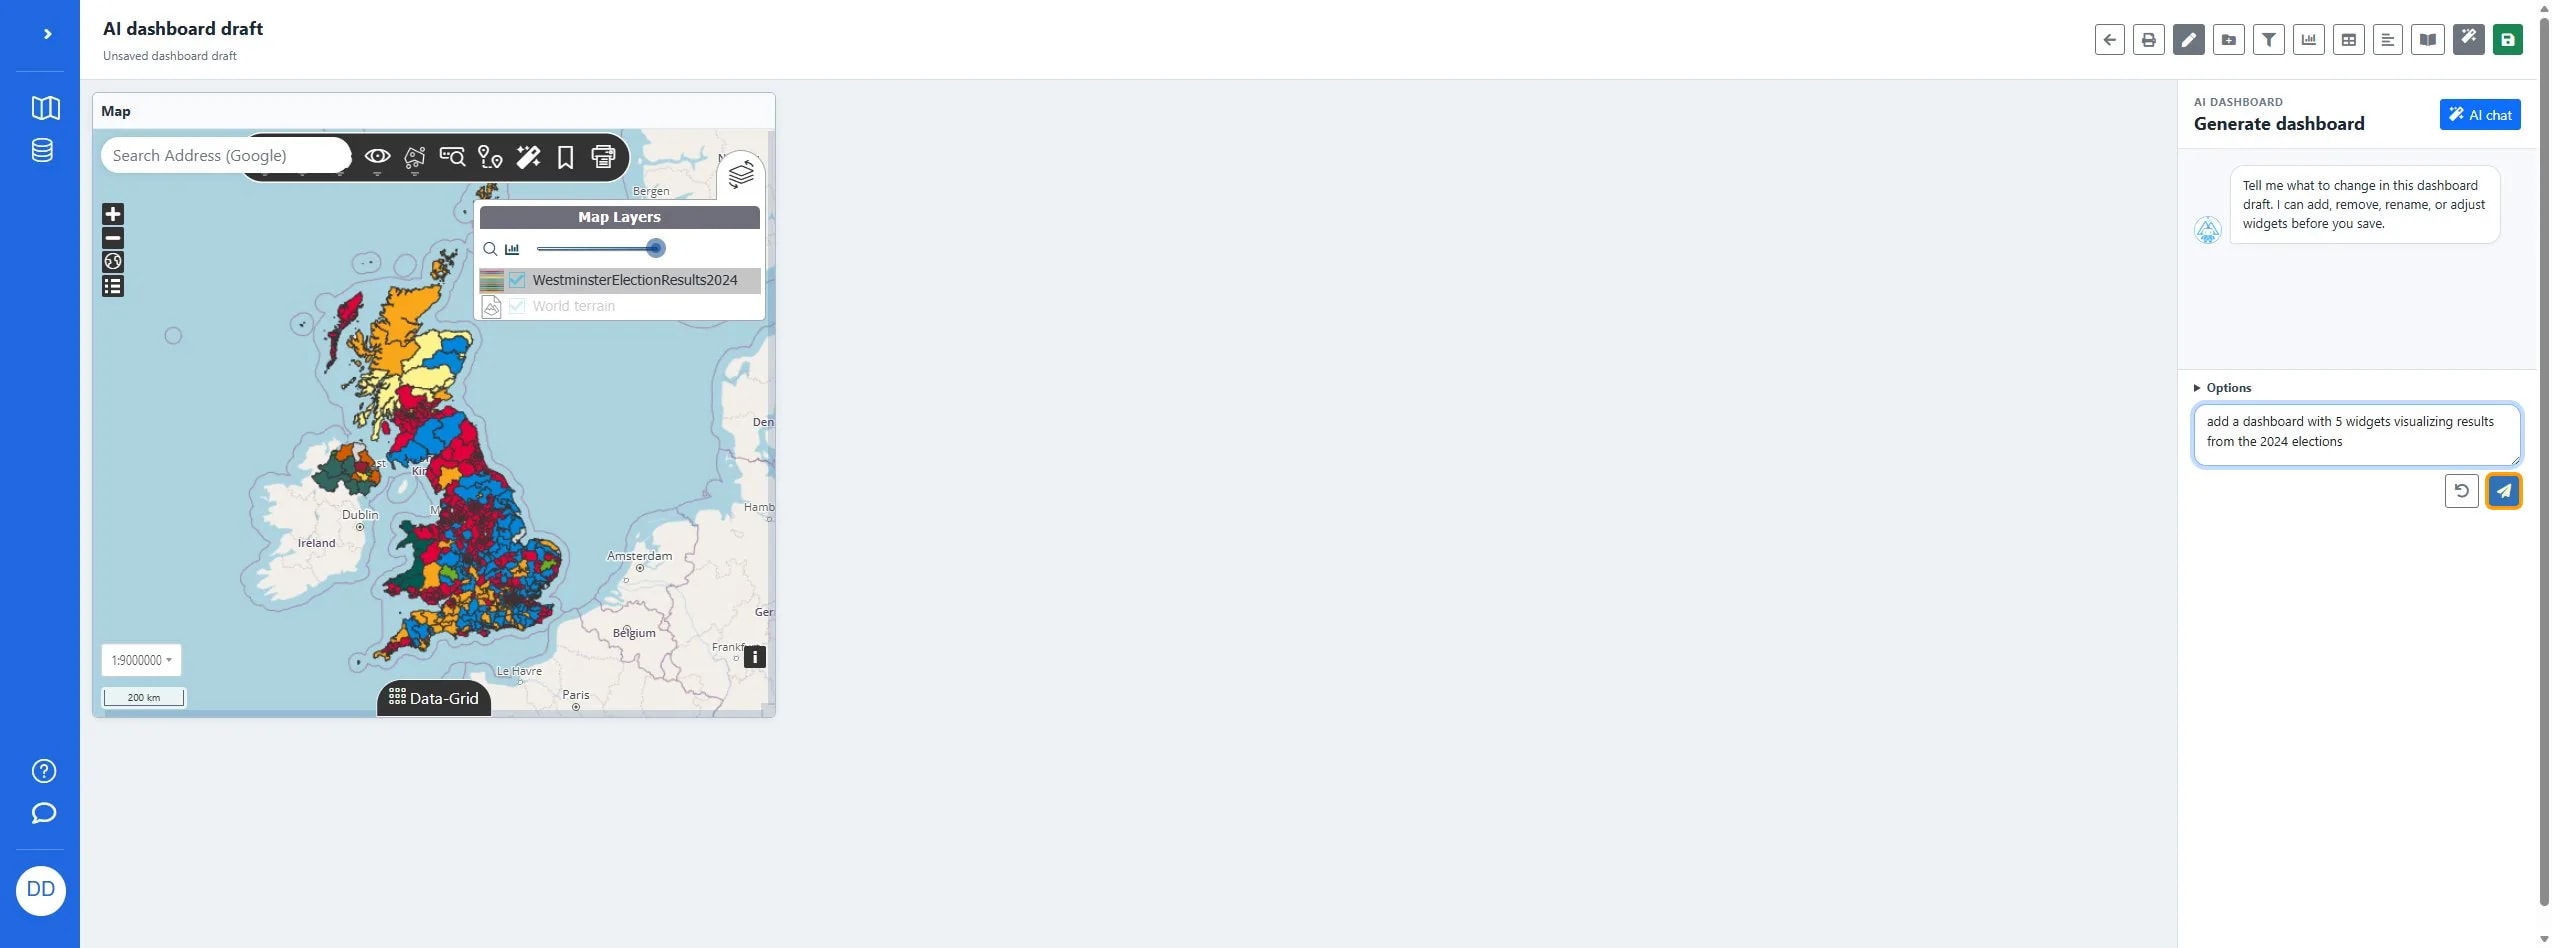
Type you natural language request.

Click the 'Ask for a dashboard edit' field to input your request.
5

Click the Send button to submit the request to generate a dashboard with 5 widgets visualizing results from the 2024 elections.

Click the Send button to submit the request to generate a dashboard with 5 widgets visualizing results from the 2024 elections.
6

5 widgets were added to the dashboard

Click the 'Edit Majority by Constituency' button to modify the chart.
7

Move by dragging header and resize chart

Click the 'Edit Majority by Constituency' button to modify the chart.
8

Move and resize the next chart to modify the pie chart visualization.

Button labeled 'Edit Votes by Party' for modifying the pie chart visualization.
9

Settle on a final position

Click the 'Edit Votes by Party' button to modify the pie chart visualization.
10

Move the last chart into position

Button labeled 'Edit Results by Region' for editing the regional results chart.
11

Happy with the result then click Save dashboard.
Save dashboard on AI dashboard draft | Azimap