How to Calculate Drive-Time Polygons
In this guide we will show how to
use drive-time analysis in Azimap.
Time to complete: 5 mins.
Contents
1. Open an existing map
2. Calculating
drive time
2.1 Using
the drive time tool
2.2 SINGLE
tab
2.3 INTERVALS
tab
2.4 GROUPS
tab
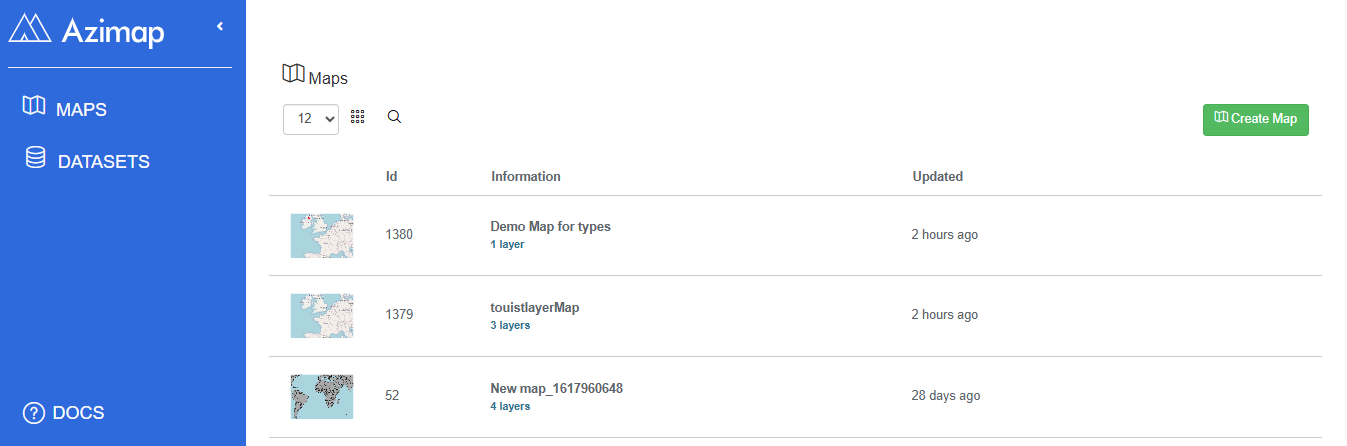
1.
Open an existing map
Click on the row of your chosen
map to open it.
2. Calculating drive time
2.1. Using the drive time tool
Select the ROUTING AND DRIVE TIME menu from the toolbar.

Select NETWORK ANALYSIS (CAR) from the menu.
This will open the drive time
side panel.
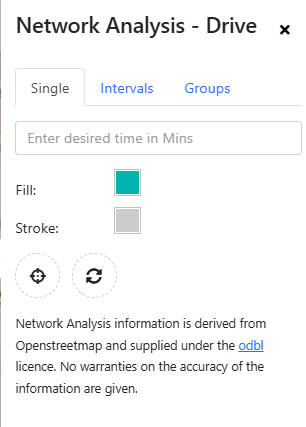
The drive time panel consists of
three tabs:
- Single drive time – analyses
where you could get to within a given drive time from a given location.
- Intervals – drive time
analysis divided up by regular time bands.
- Groups – select multiple
point features on a map and get drive time polygons for each.
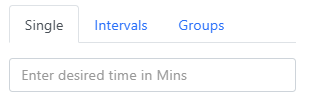
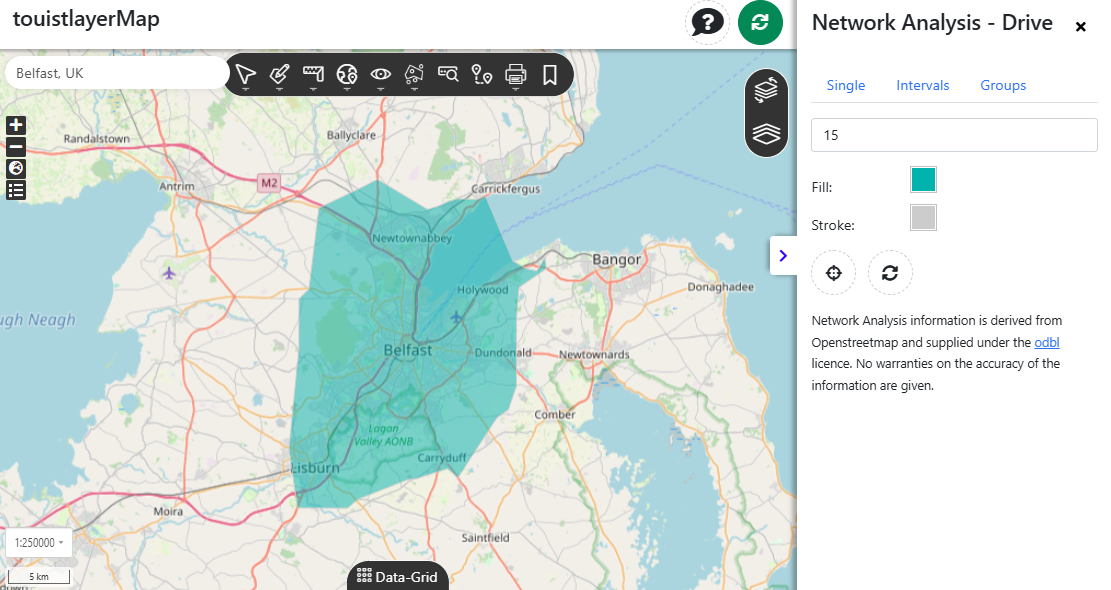
2.2. SINGLE tab
Use the SEARCH box to enter your
desired drive time in minutes.
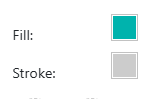
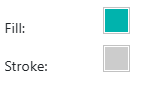
Choose drive time polygon fill colour
and stroke colour.
Reset form to defaults.

Select your ‘from’ location (use button
to click map to choose starting point).

2.3.
Example
I selected the Belfast in Northern Ireland as my centre point and got the resulting drive time polygon showing 15 mins drive time in all directions.
2.4. INTERVALS tab
The INTERVALS panel allows for
the analysis of regular drive time bands from a given location. E.g. in this example, we’ll be raising a
polygon that will show a 30 minute drive time from Belfast, in 15 minute
bands.
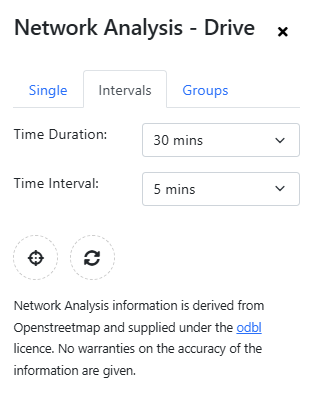
There are two input boxes:
- Time duration – max time of
analysis
- Time interval – band size of
drive time polygon
Reset form to defaults

Generate drive time ‘from’
location (select button and then click map to generate drive time polygons).

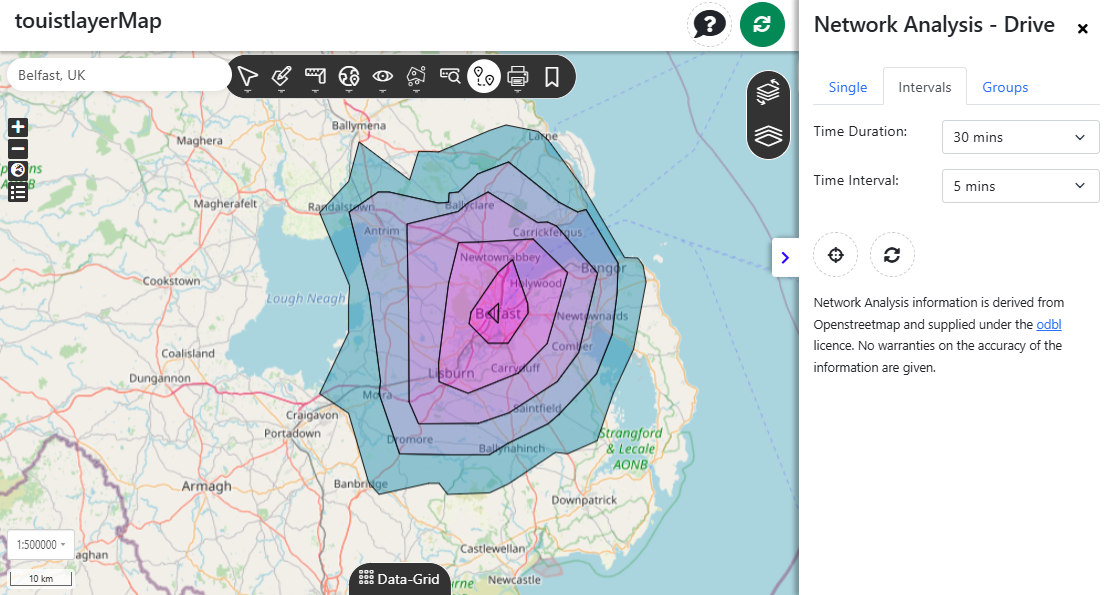
Again, I selected the Belfast in Northern Ireland as my ‘from’ location and got the resulting drive time
polygons showing 30 mins drive time in all directions in 5 minute bands.
2.5. GROUPS tab
The groups panel allows for the
analysis of multiple drive times calculated from selected points on a map layer
(single or multi).
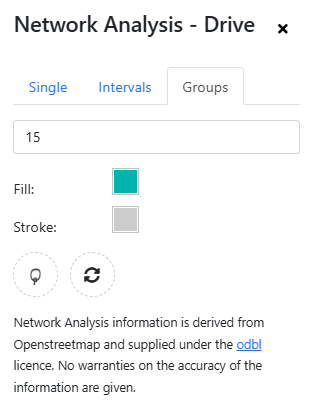
Search box for drive time in
minutes.

Choose drive time polygon fill colour
and stroke colour.
Reset form to defaults.

Select multiple point features on
a map using lasso tool. This analysis will only be performed on any point that
falls within the polygon that you draw with this lasso tool.

?The points marked on the map will appear as a blue square while they are being collected.
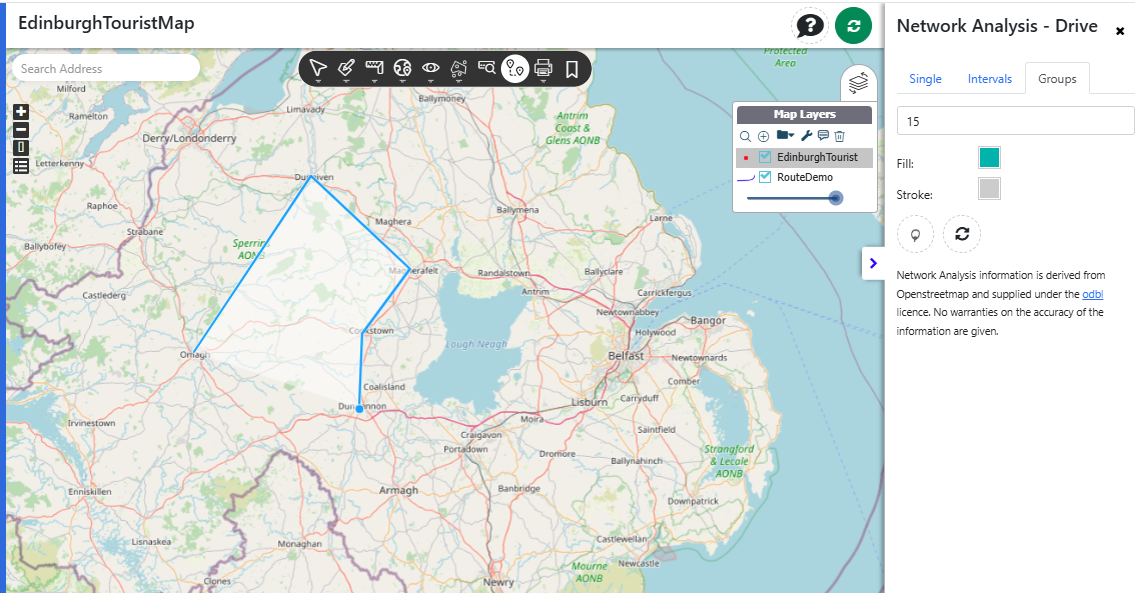
The selected features should look
as below.
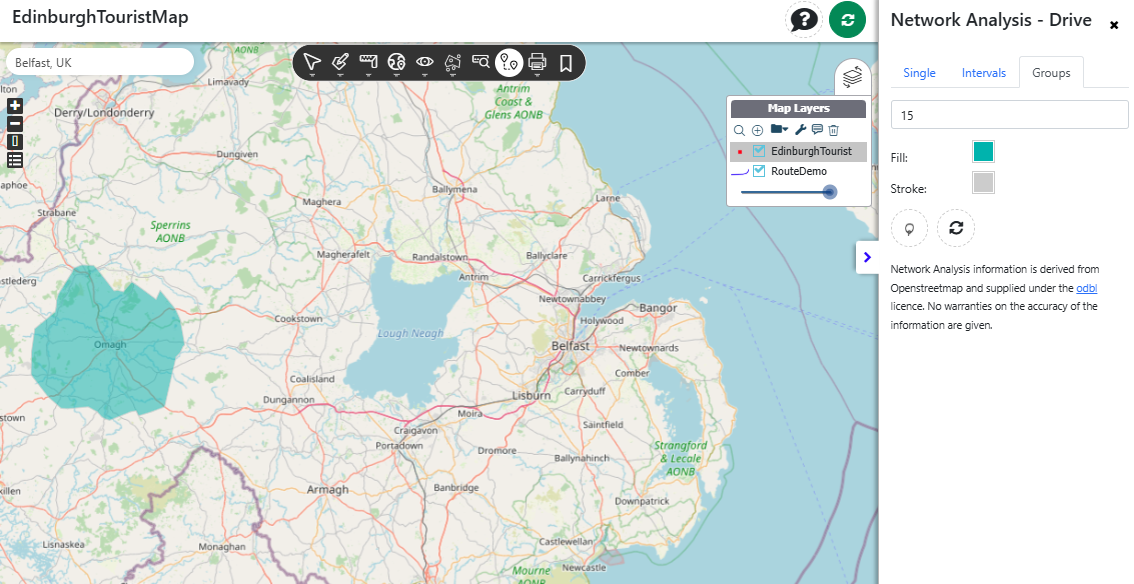
This generates 15-minute drive
times for each of the selected points.
That’s all for our drive time
analysis.
Thanks for reading the guide and we hope you plan
your future routes with Azimap.
If you haven't signed up yet go to the Azimap website and
click REGISTER.