This workflow guides users through analyzing planning applications in Northern Ireland using the Azimap platform. It includes steps for querying map data, generating charts, and configuring dashboards.
1
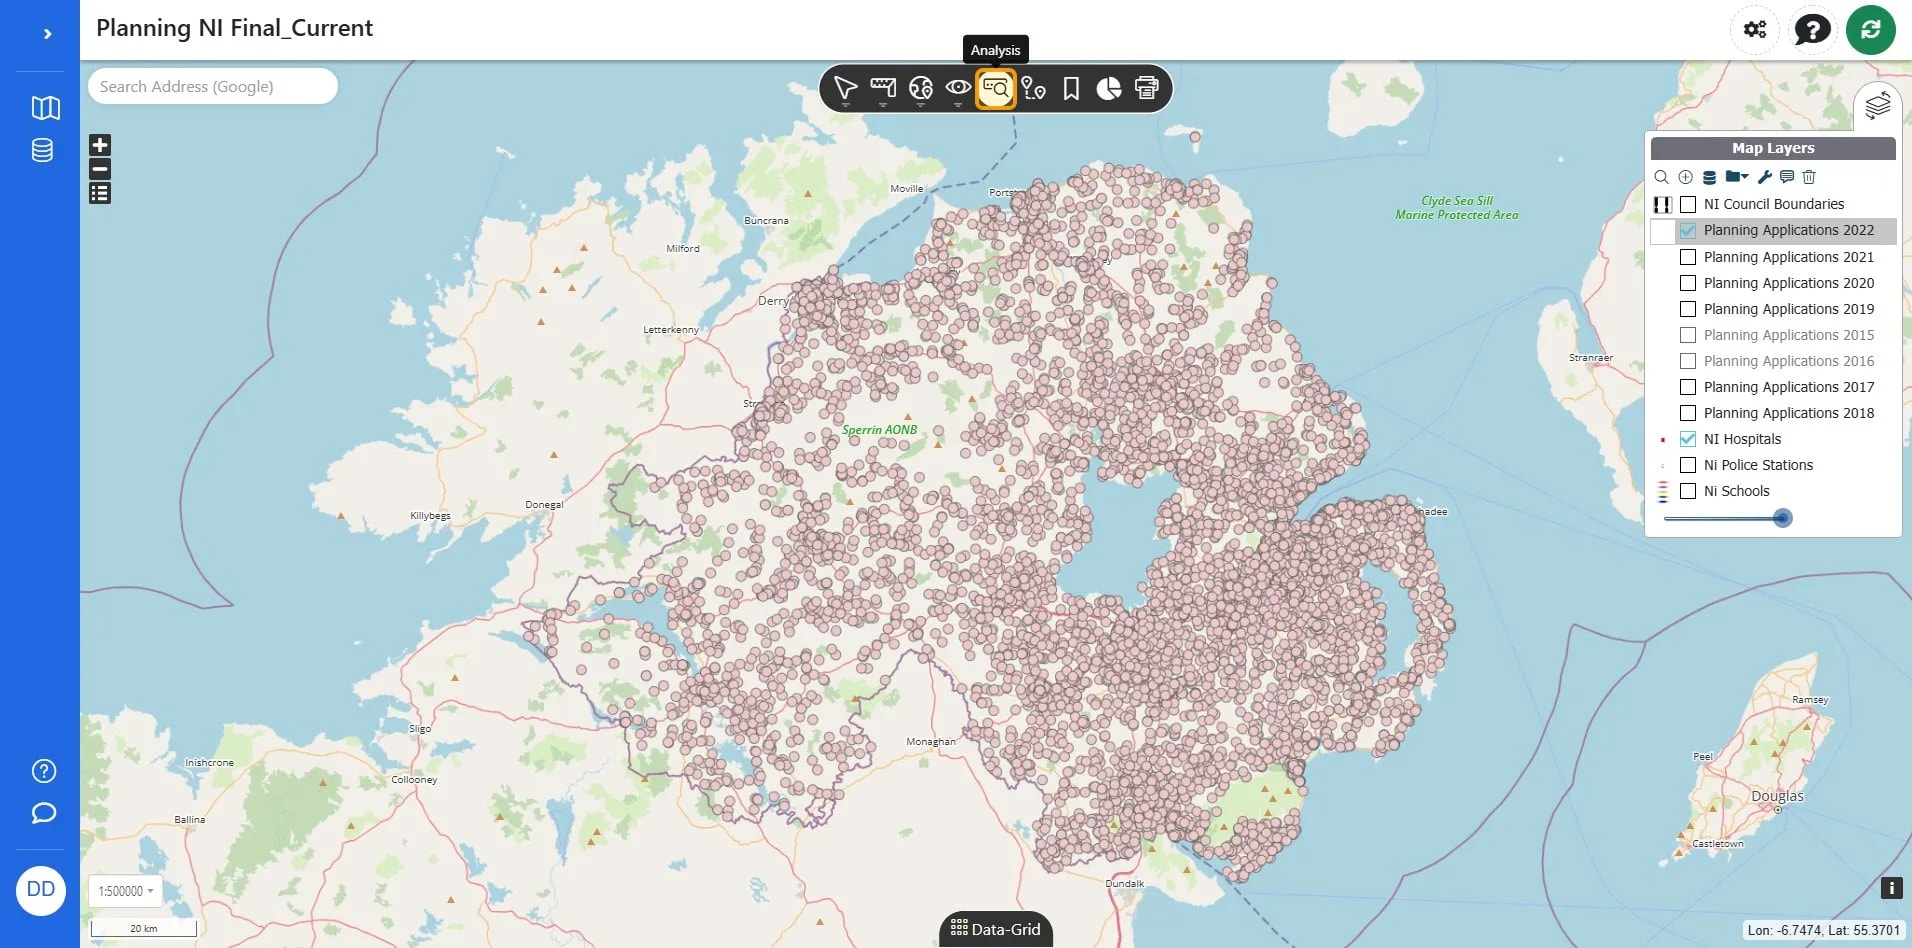
Click the Analysis button to access analytical tools for planning applications.
2
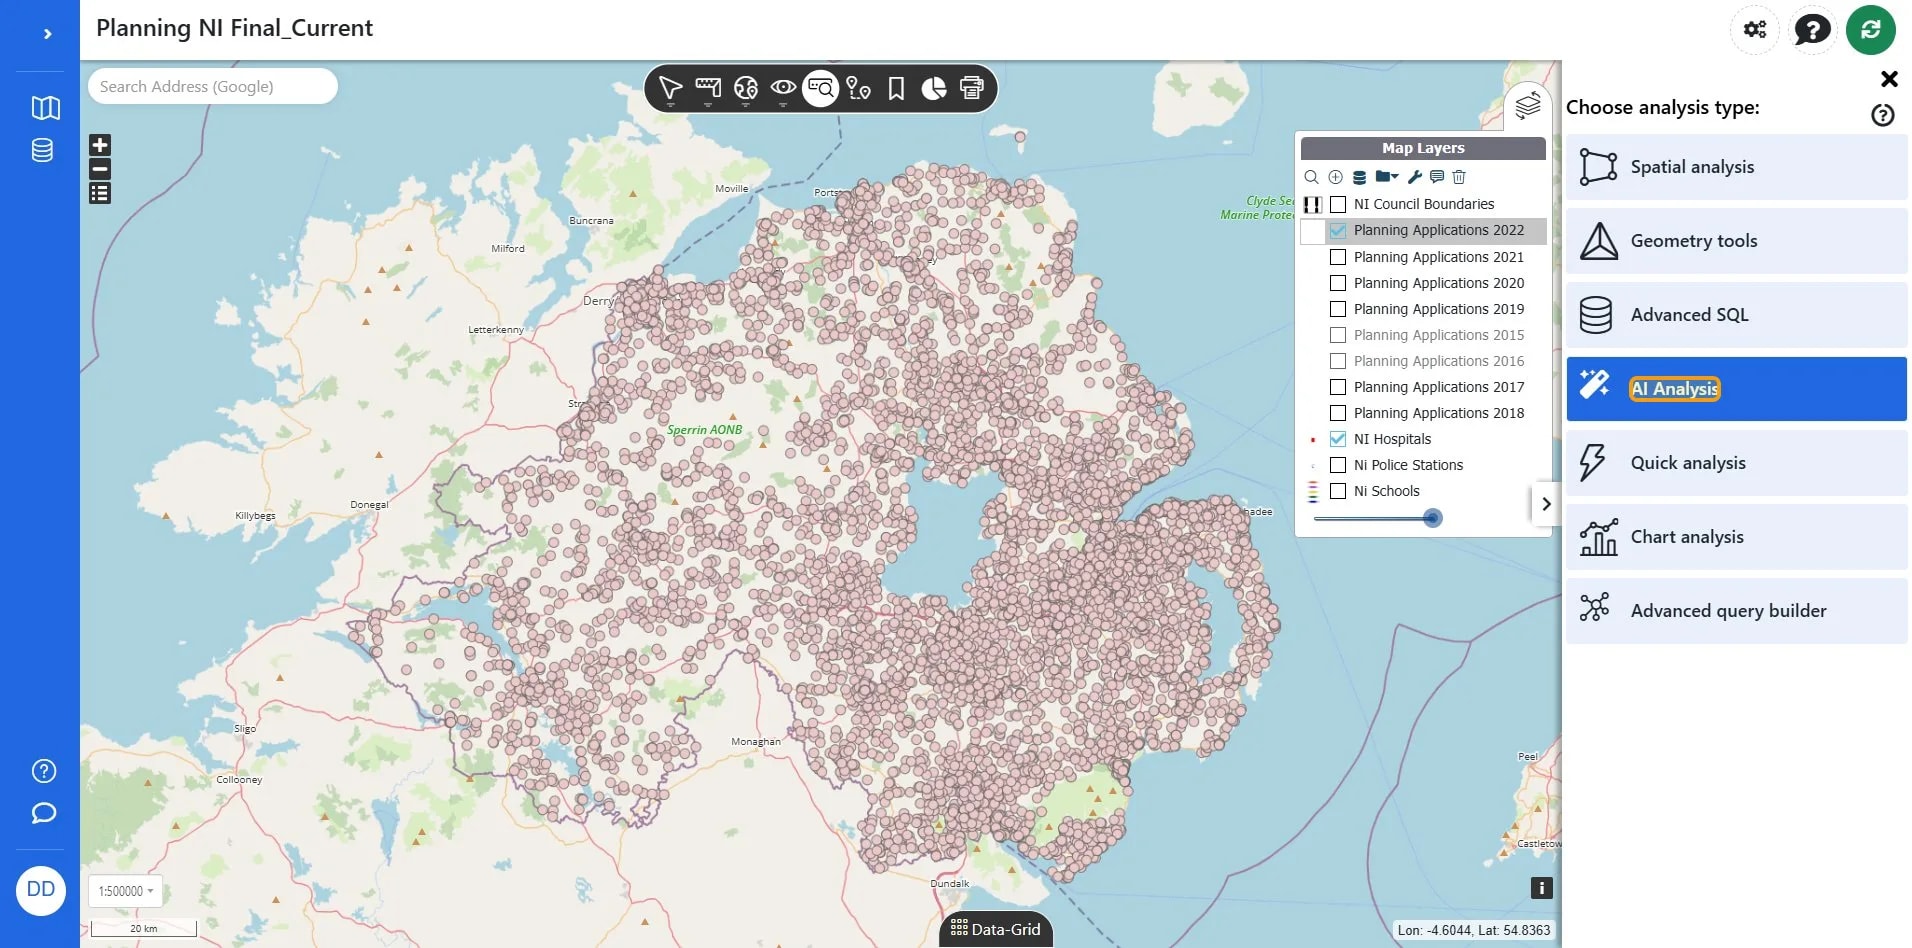
Click AI Analysis.
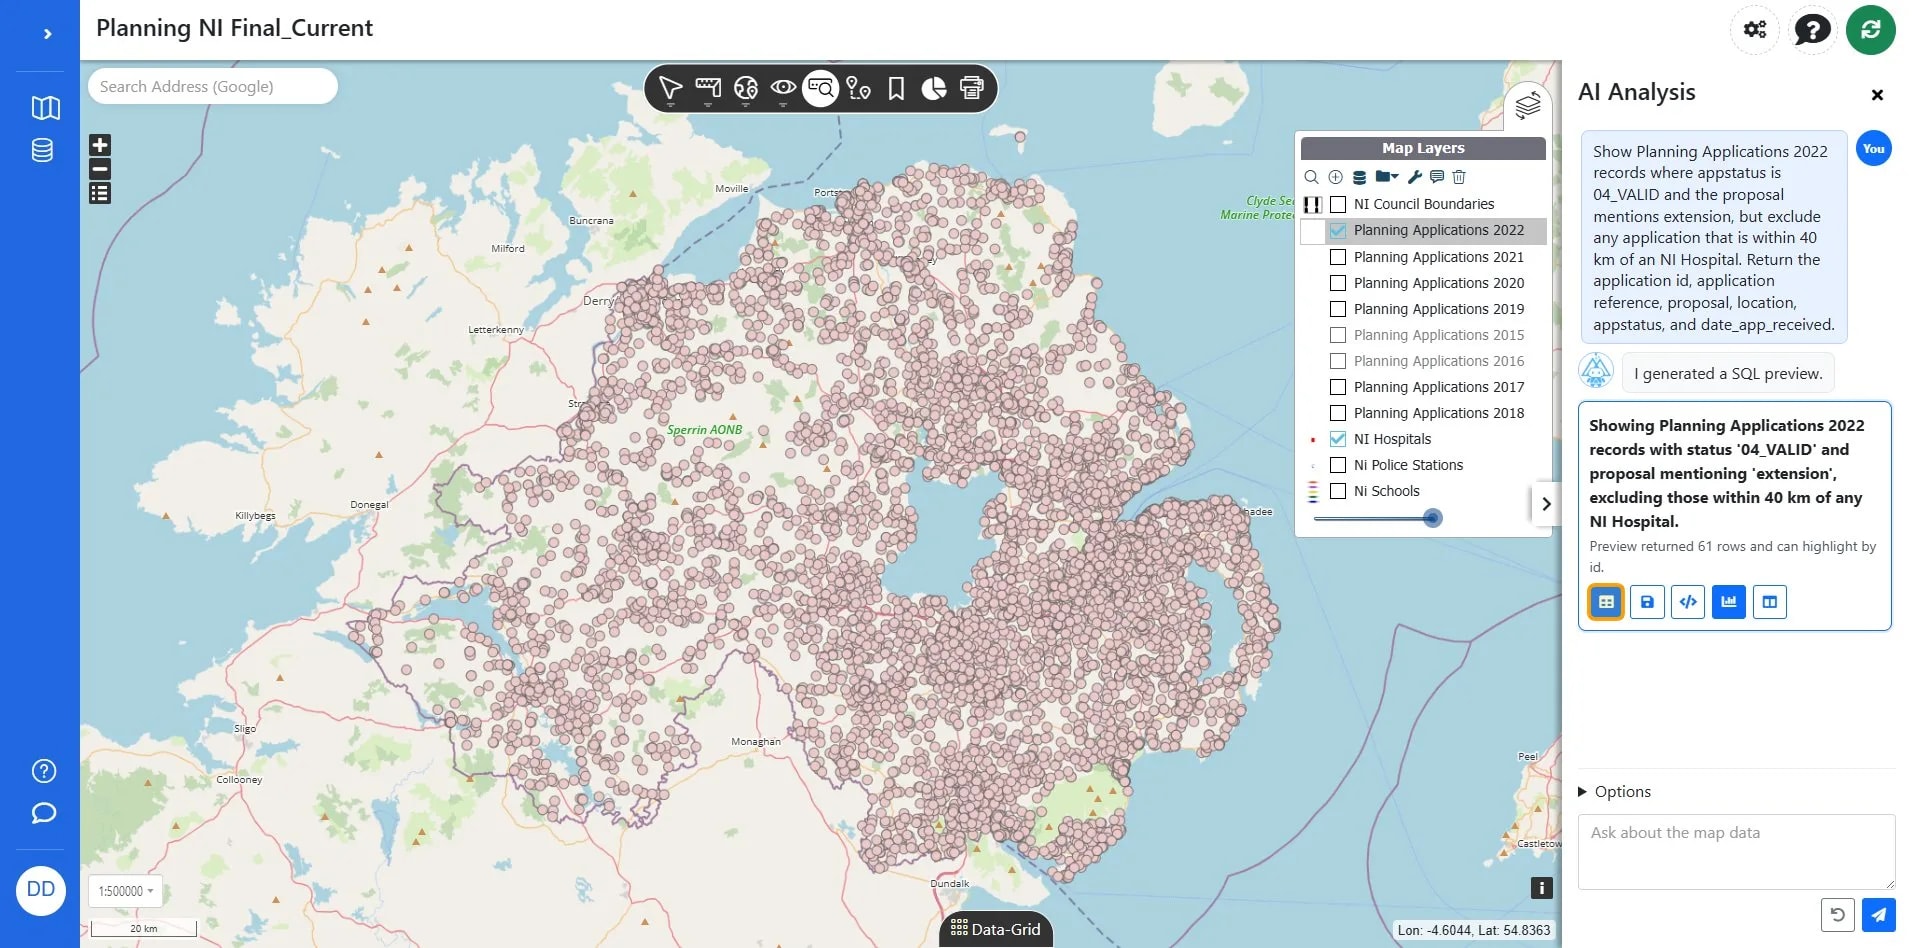
TipPrompt: Show Planning Applications 2022 records where appstatus is 04_VALID and the proposal mentions extension, but exclude any application that is within 40 km of an NI Hospital. Return the application id, application reference, proposal, location, appstatus, and date_app_received.
AlertAI can only ever create insights into visible layers on the map
3
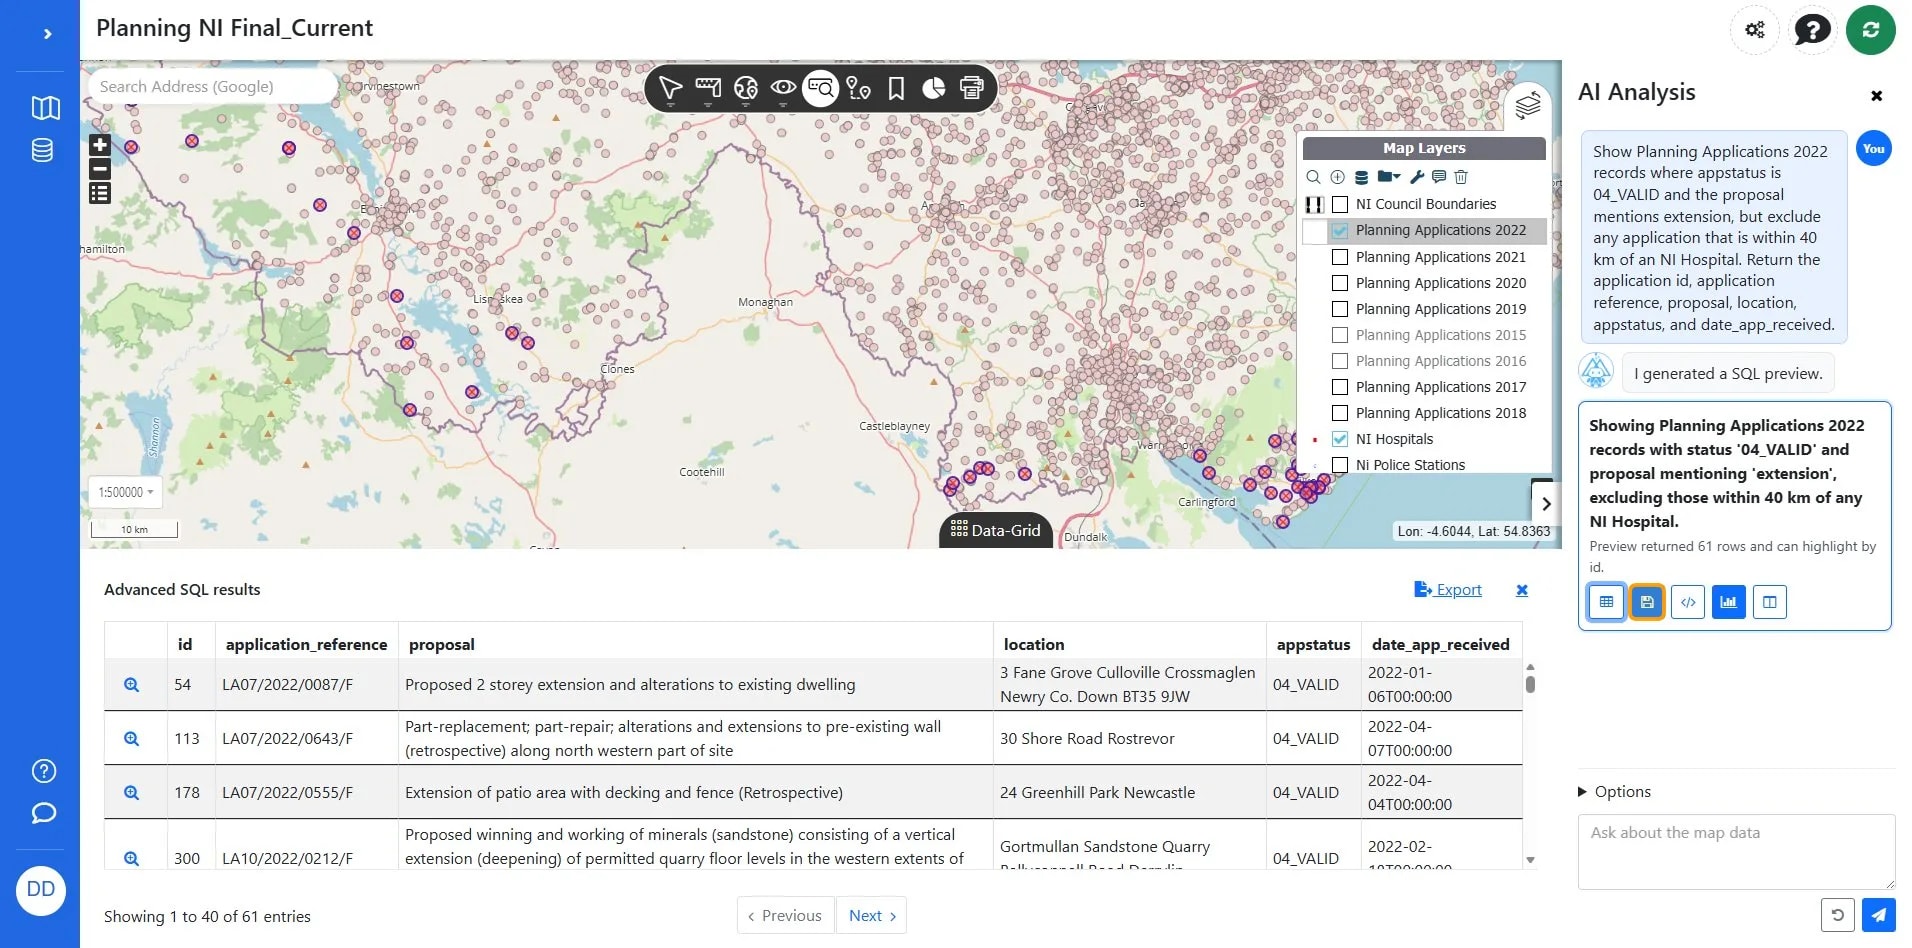
Click the Open grid button to display the data in a tabular format.
TipIf performing a second unrelated query, hit the reset button first.
4
Click Save result to save for later if desired.
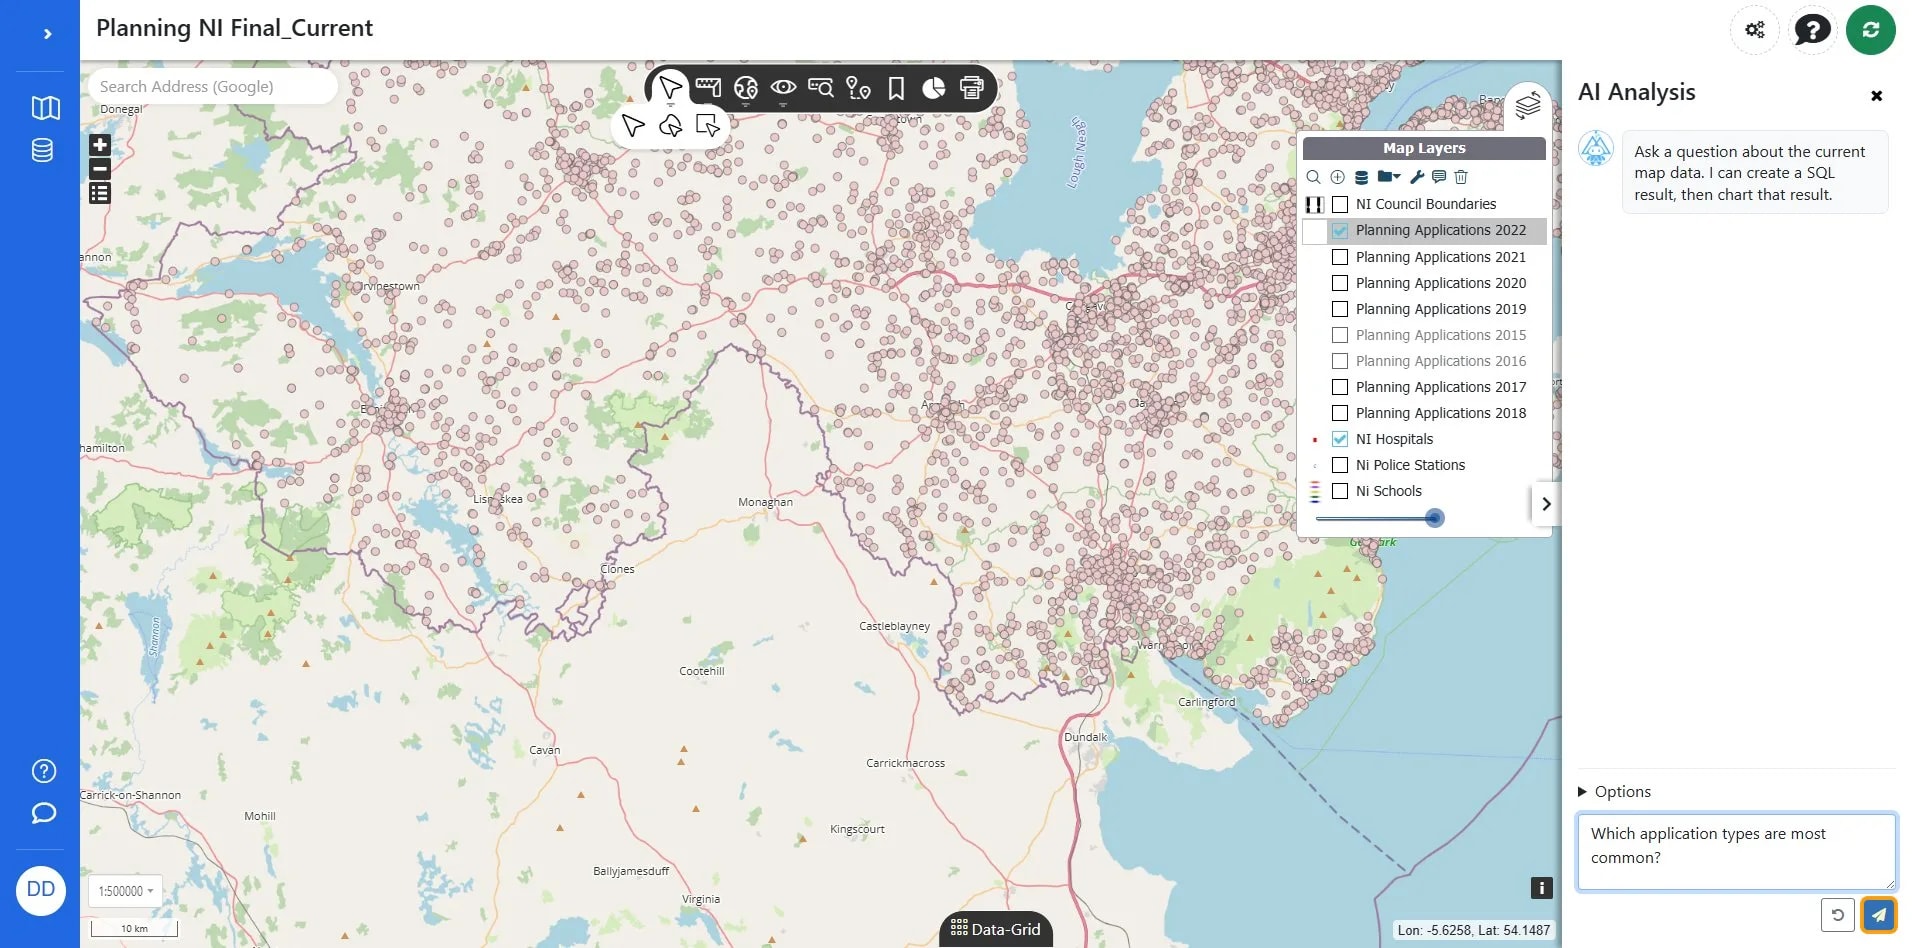
TipPrompt: Which application types are most common?
5
Click the 'Send' button to submit your query about application types for the Planning NI Final_Current map.
6
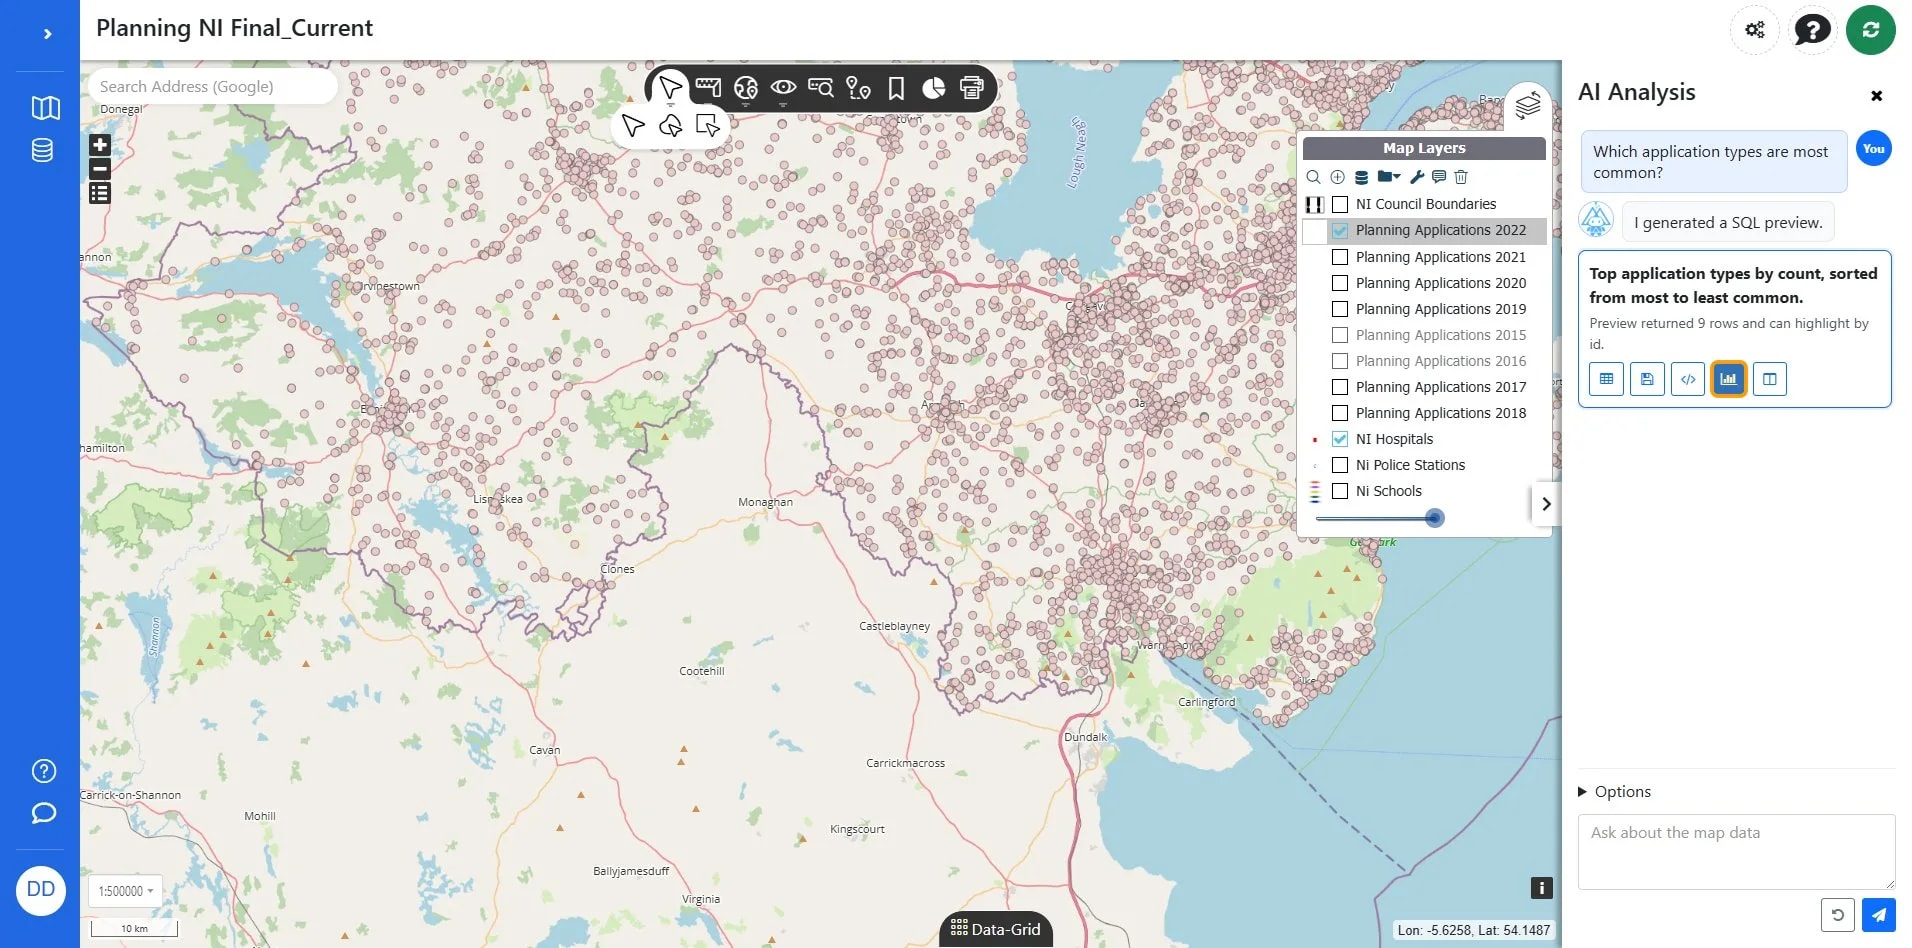
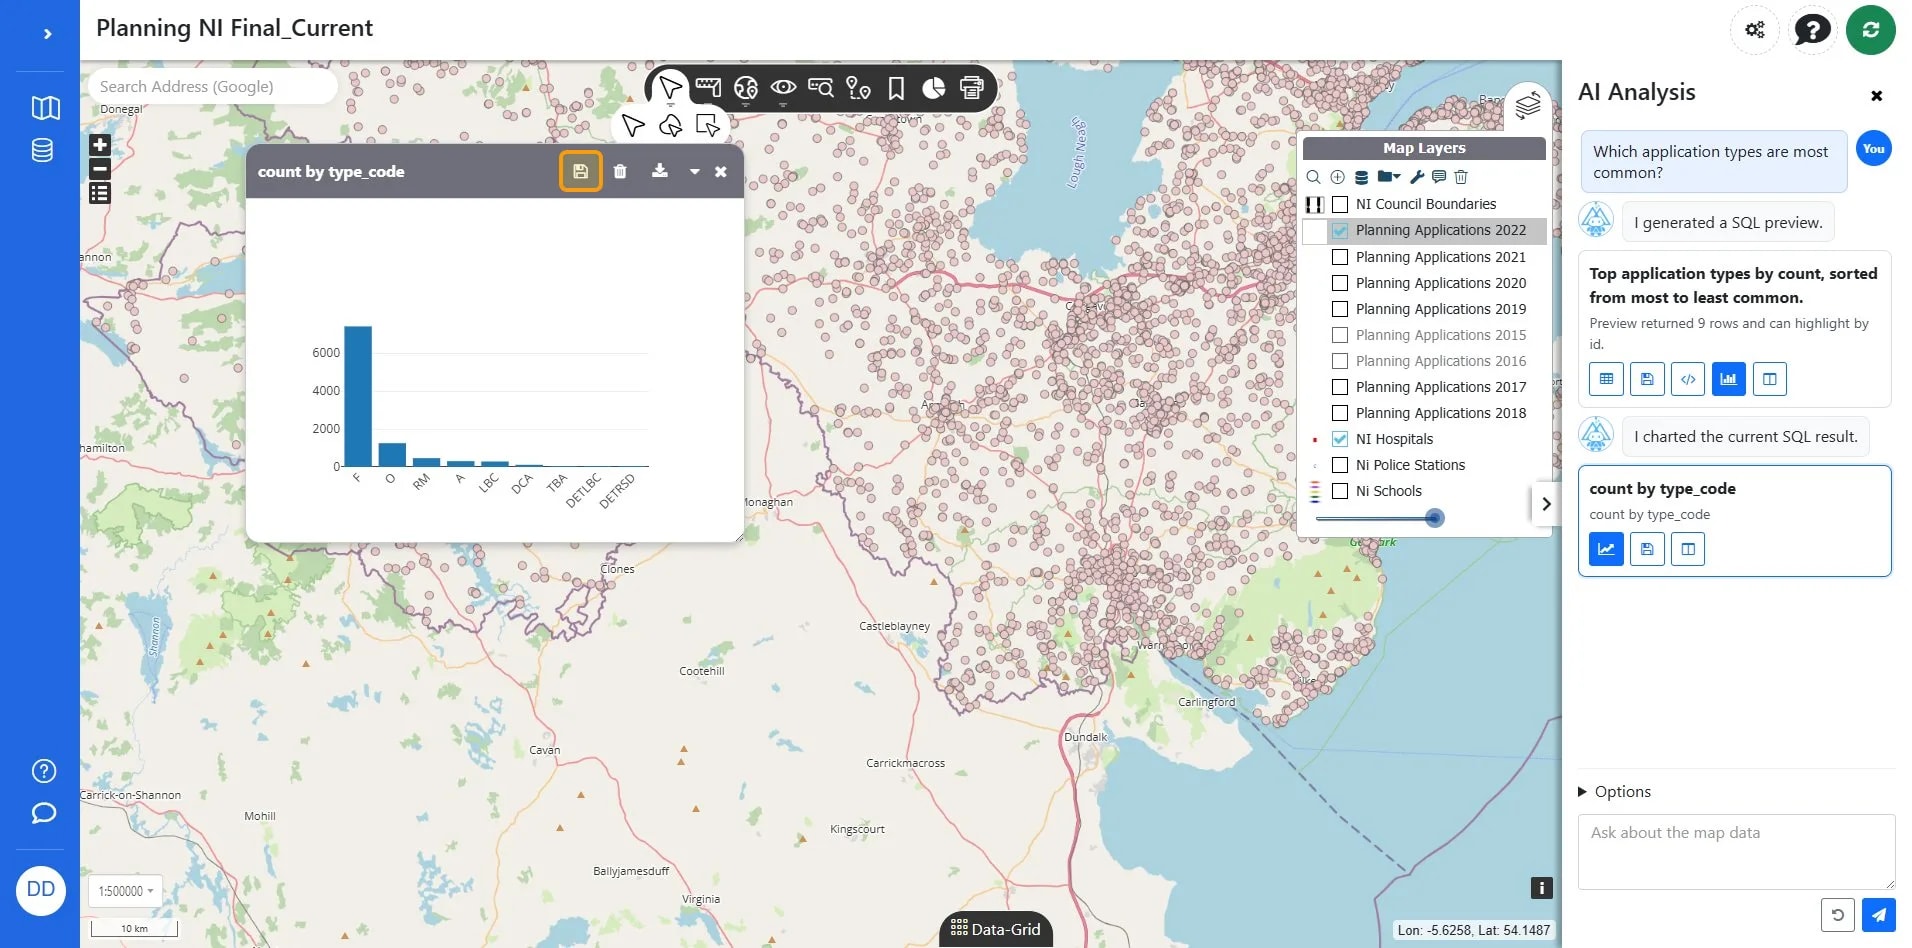
Click the Chart this button to generate a chart of planning applications.
7
Click Save configuration if want to reaccess later.
8
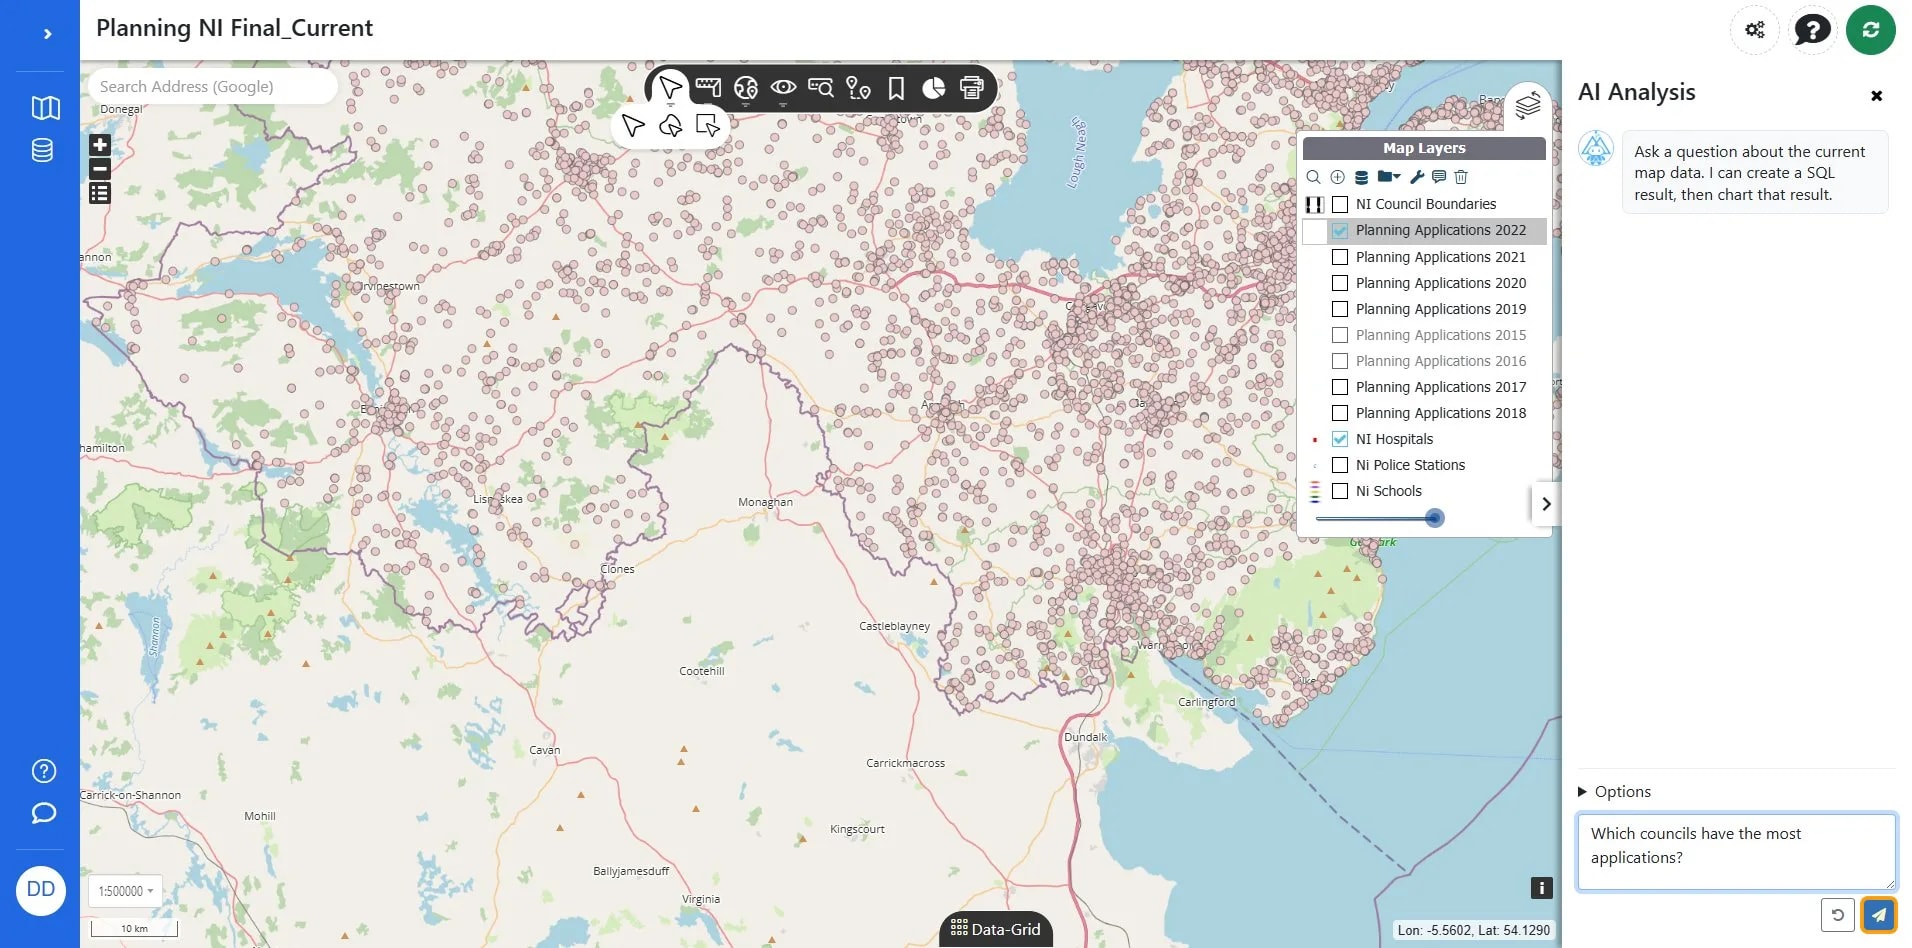
Click the Send button in the AI Analysis panel to submit the question about which councils have the most applications.
9
If you want a different type of chart, ask for it (Pie chart in this instance) Click the 'Open chart' button to view the pie chart of planning applications by council.
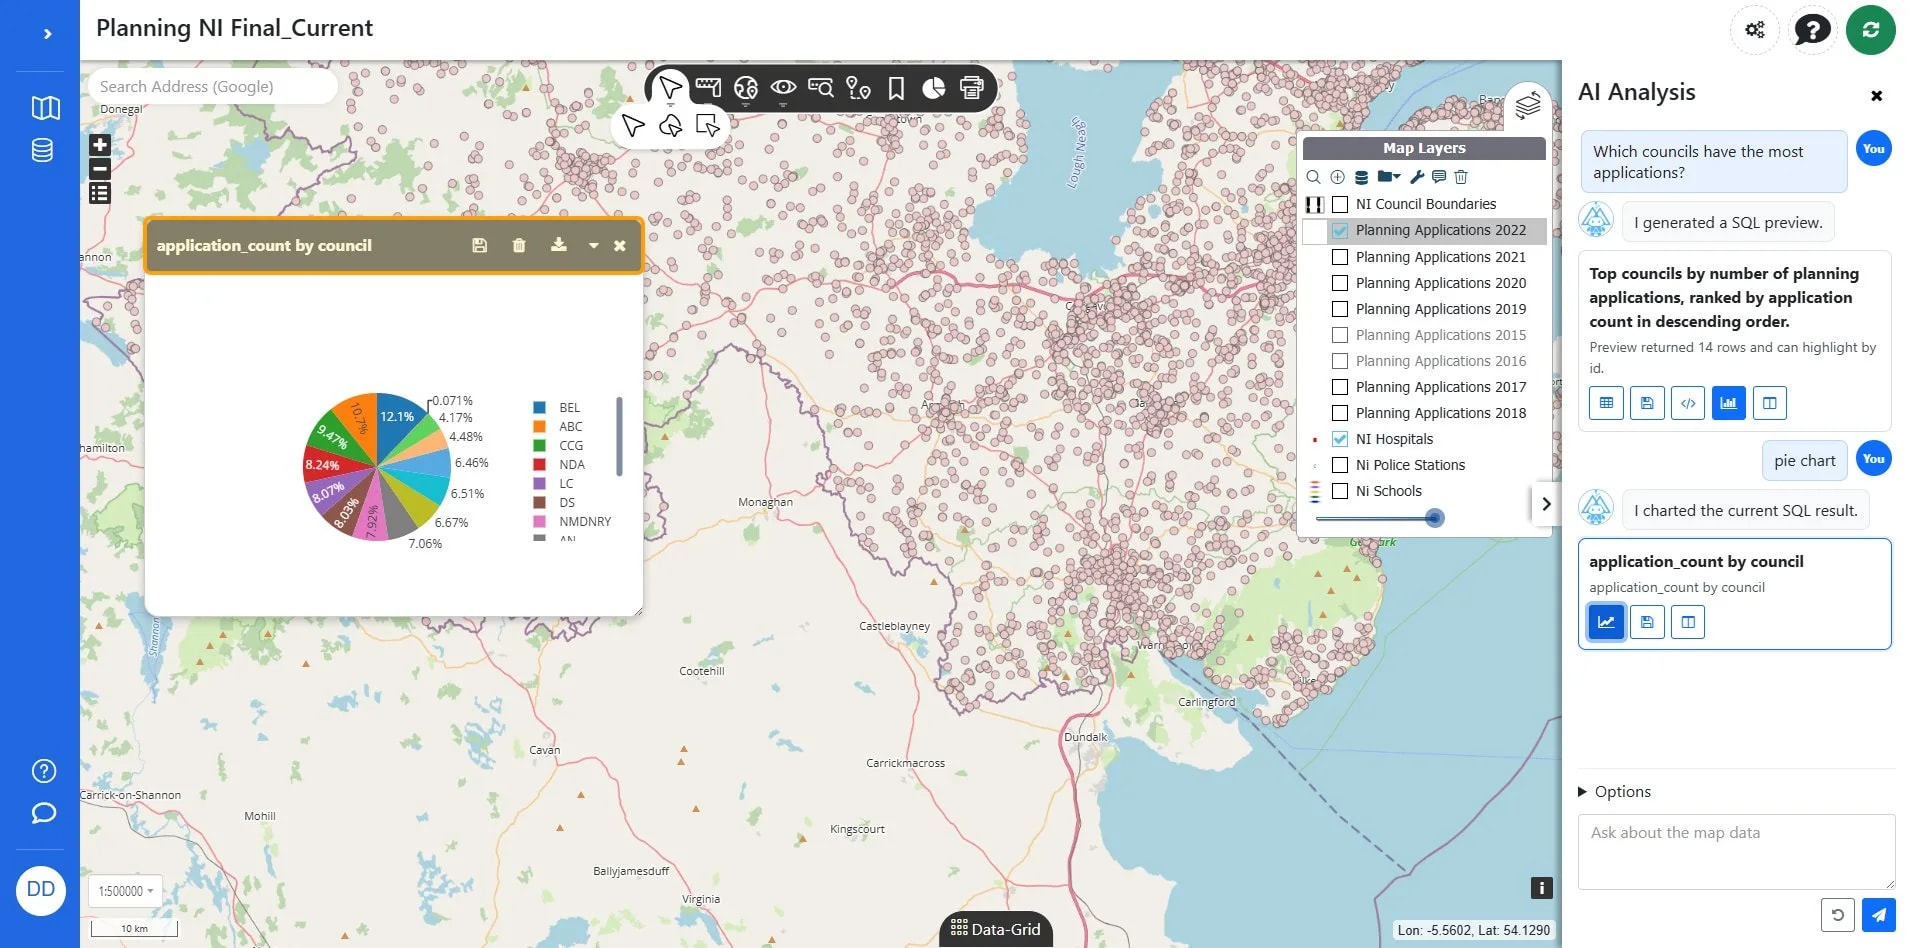
10
Click Save configuration.
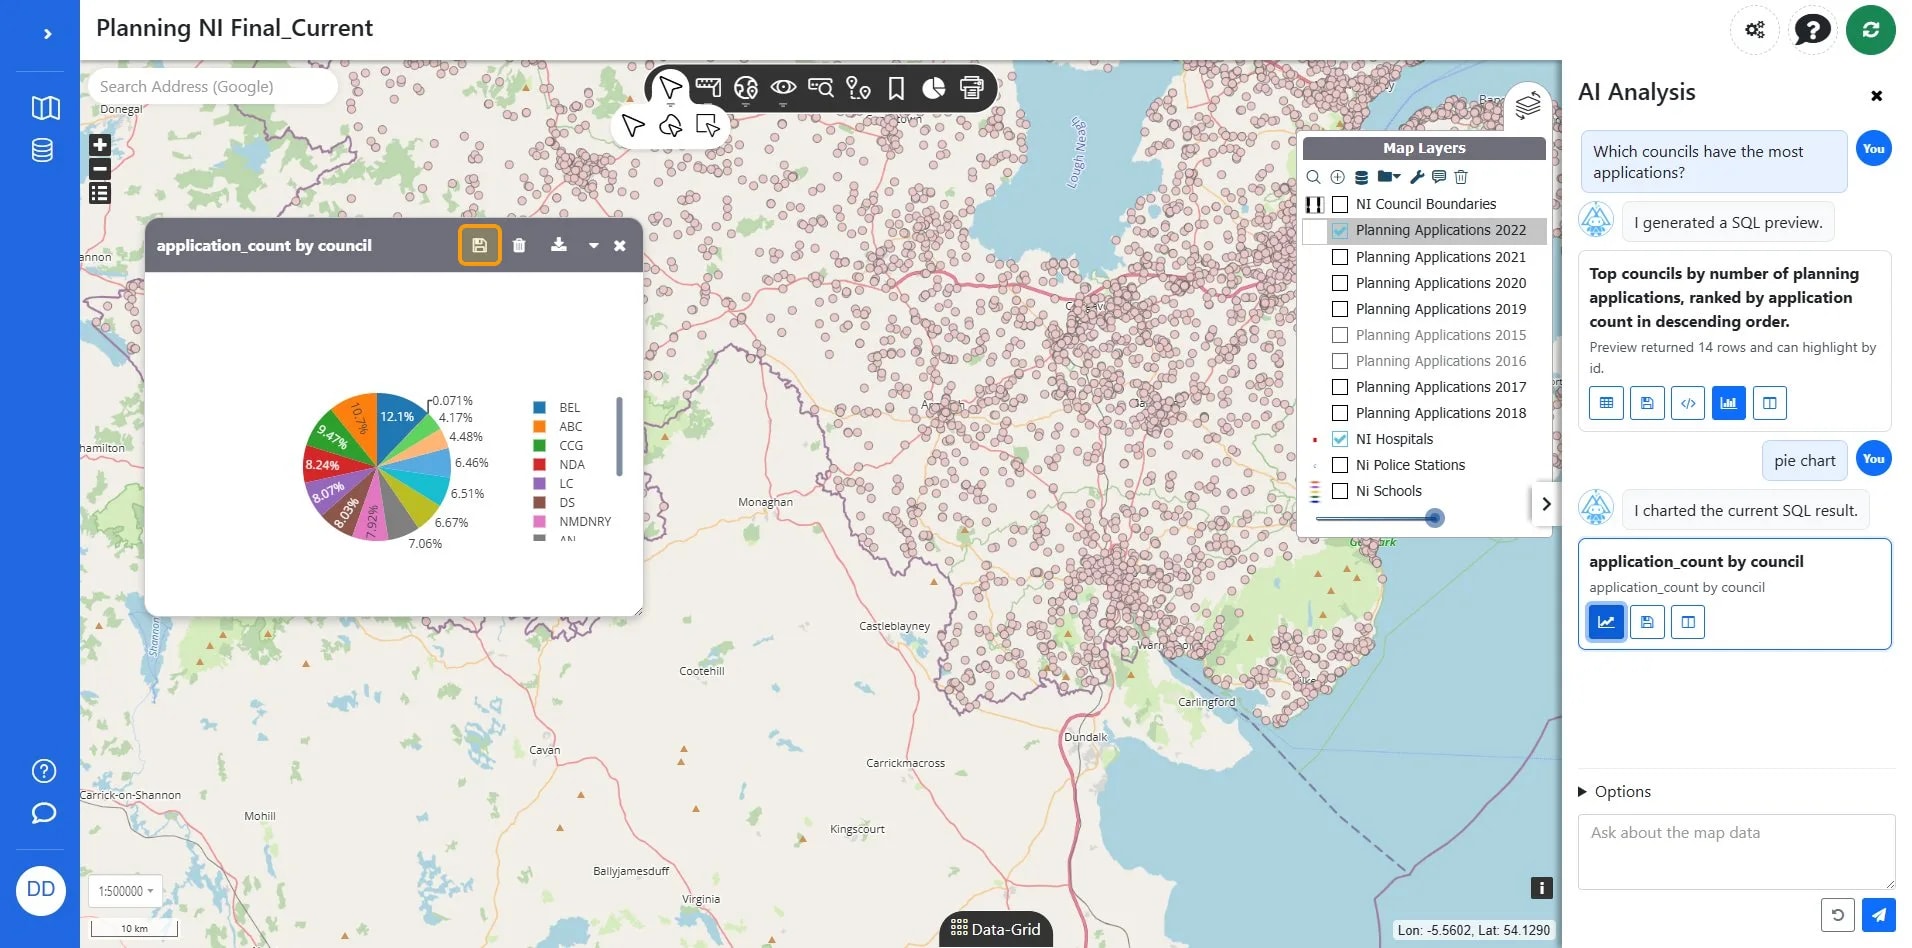
11
Click the Reset button to return the map to its initial state.
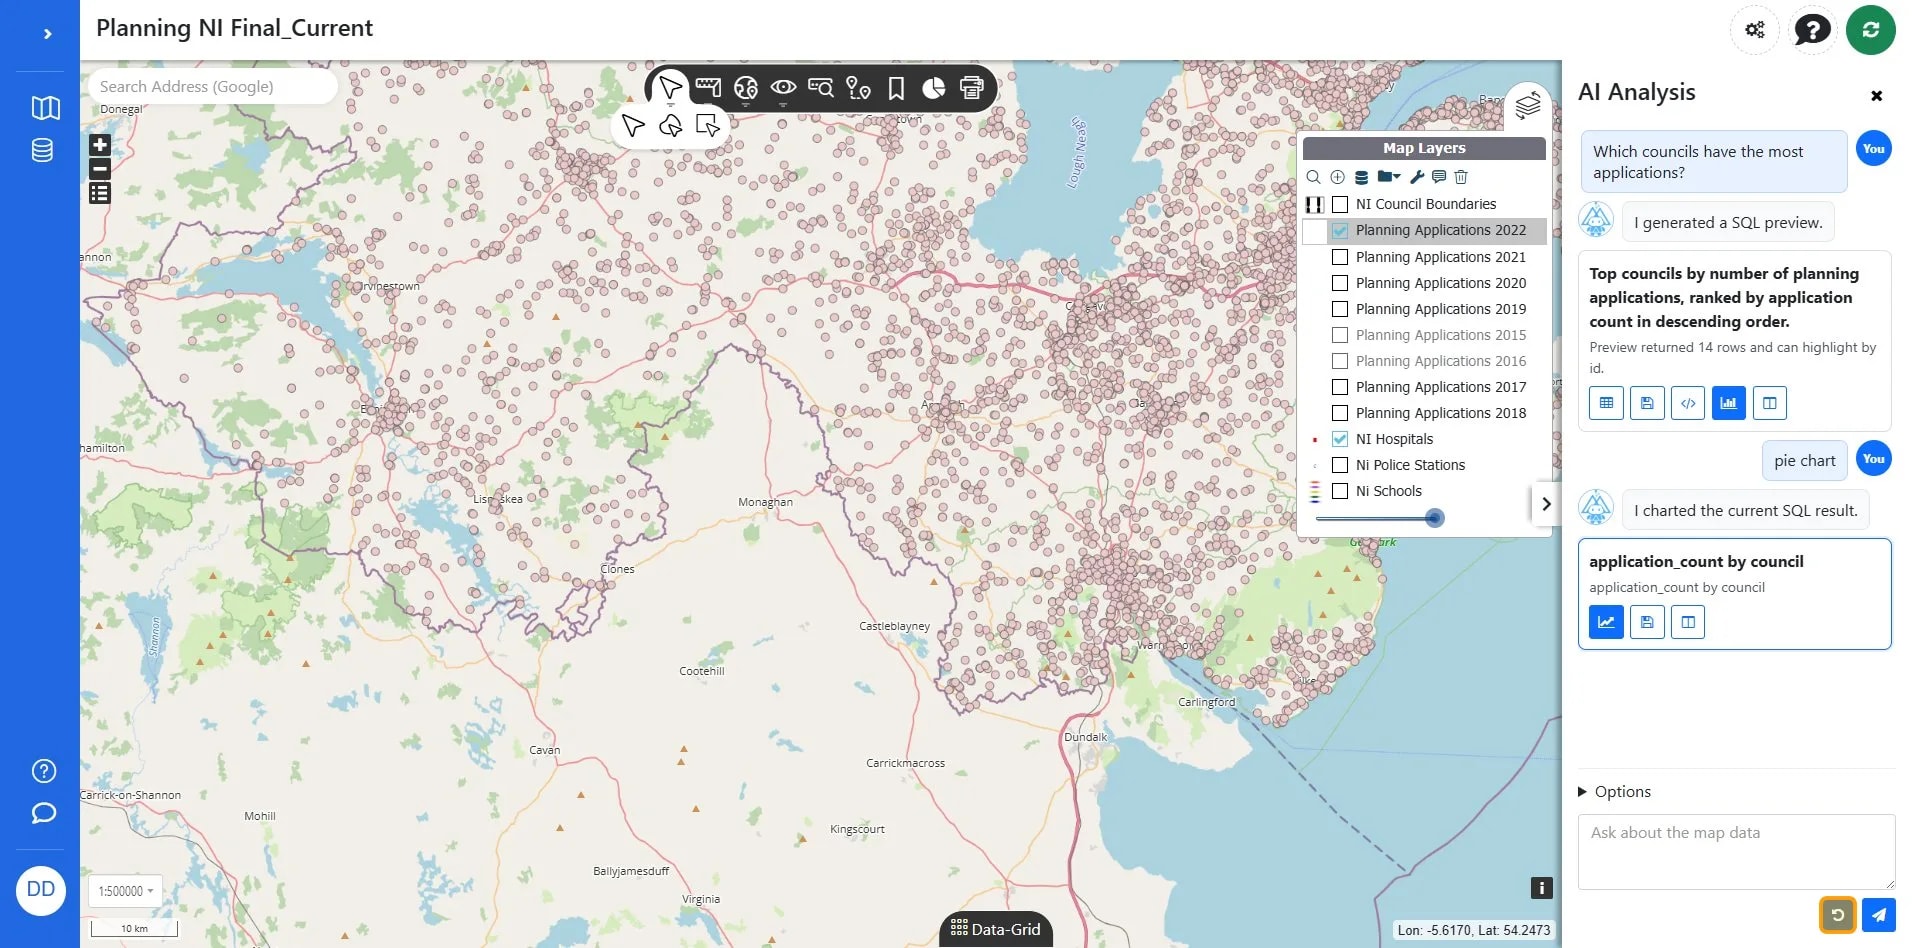
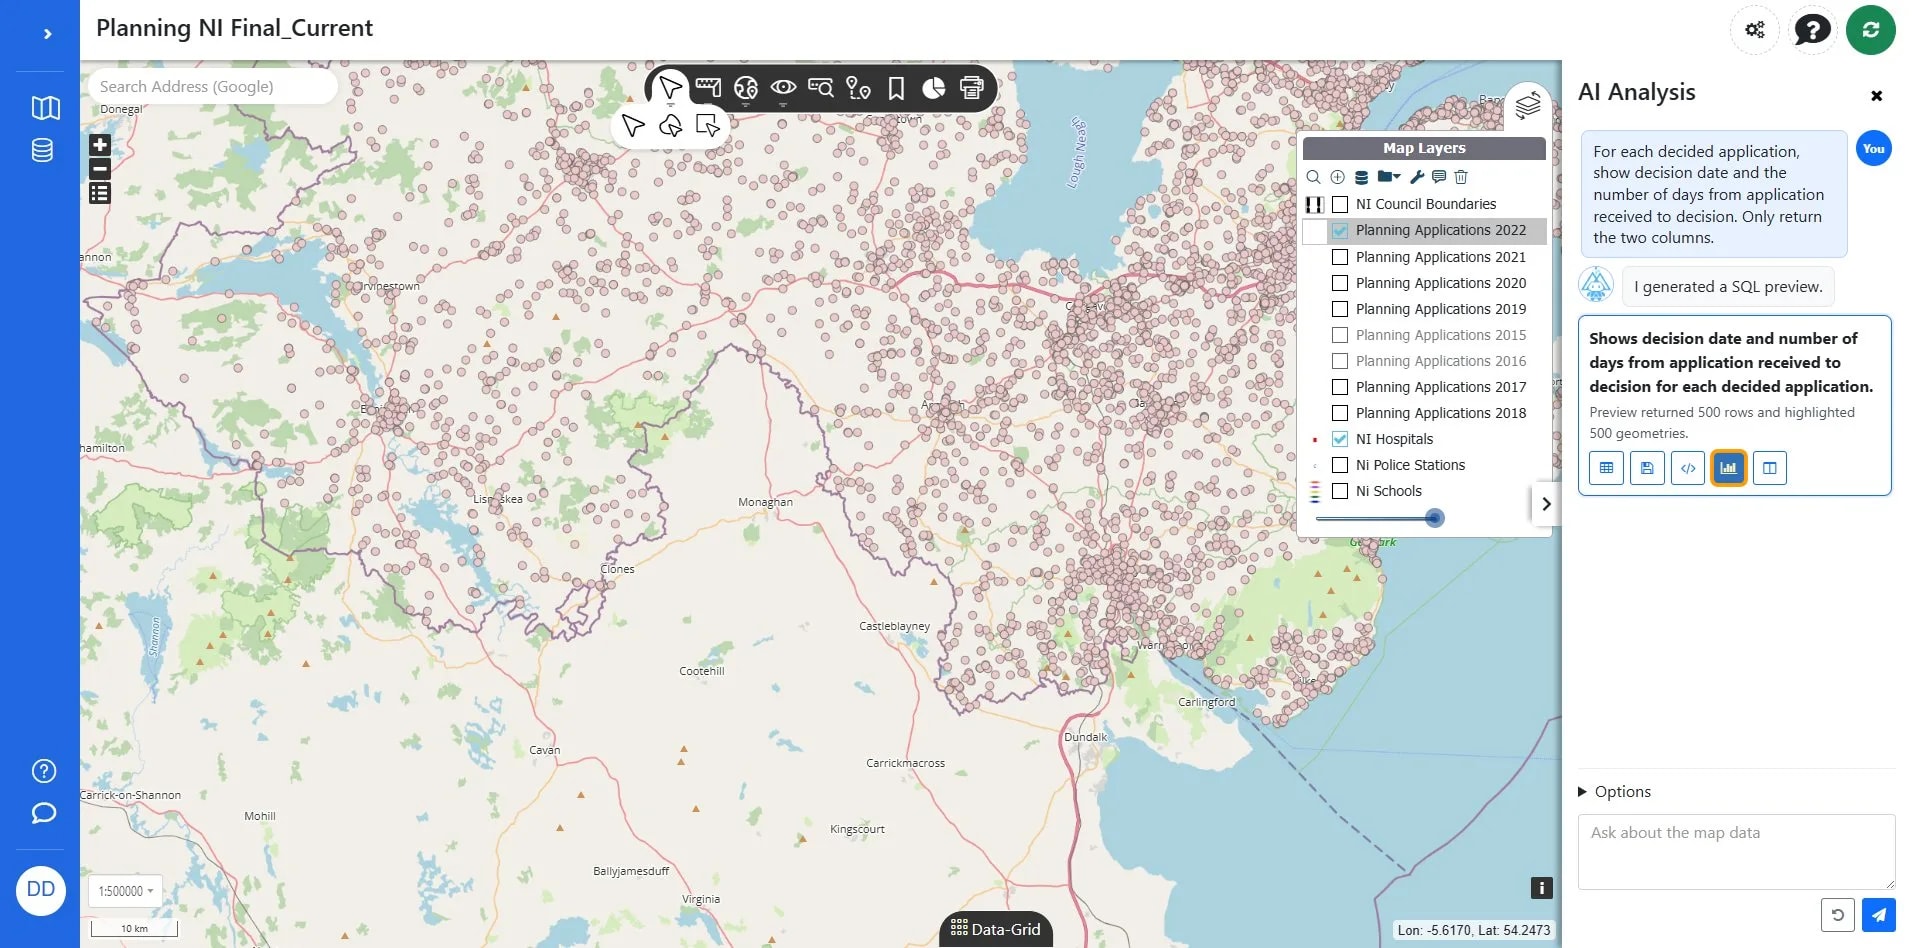
TipPrompt: For each decided application, show decision date and the number of days from application received to decision. Only return the two columns.
12
Click the Send button to submit your query about the map data for analysis.
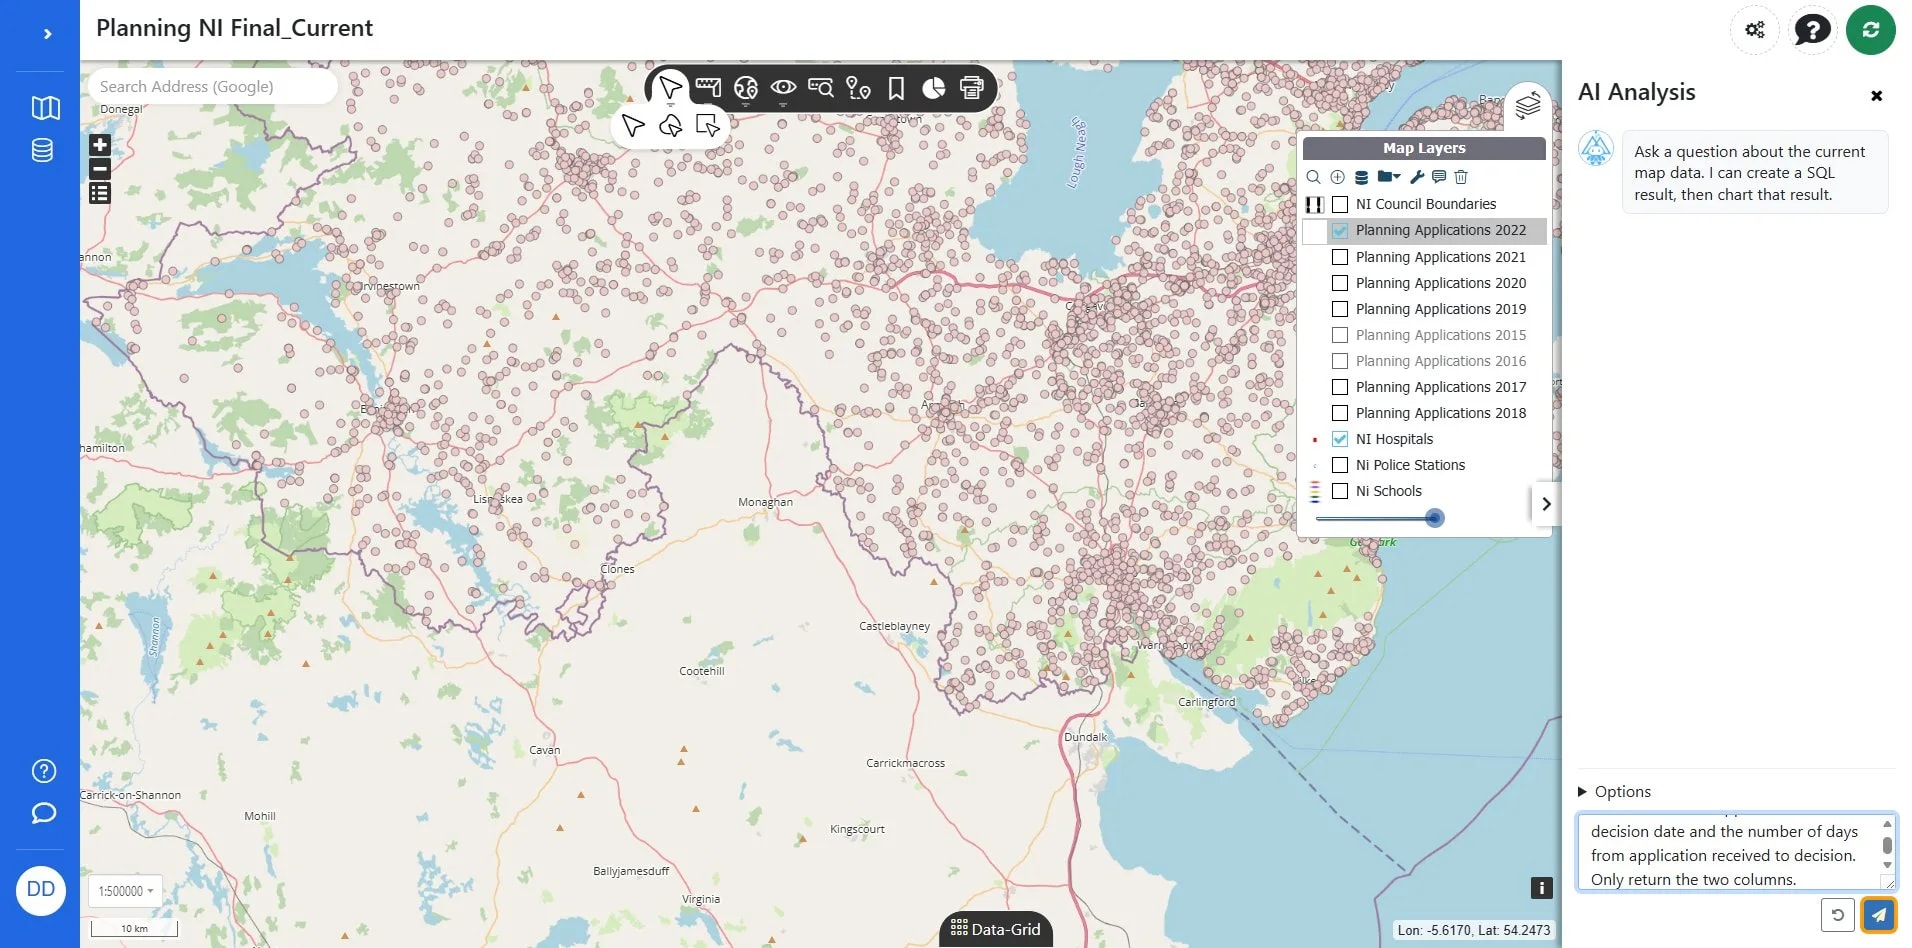
13
Click the Chart this button to generate a chart based on the selected data.
14
Click the Report dashboards button to access reporting options.
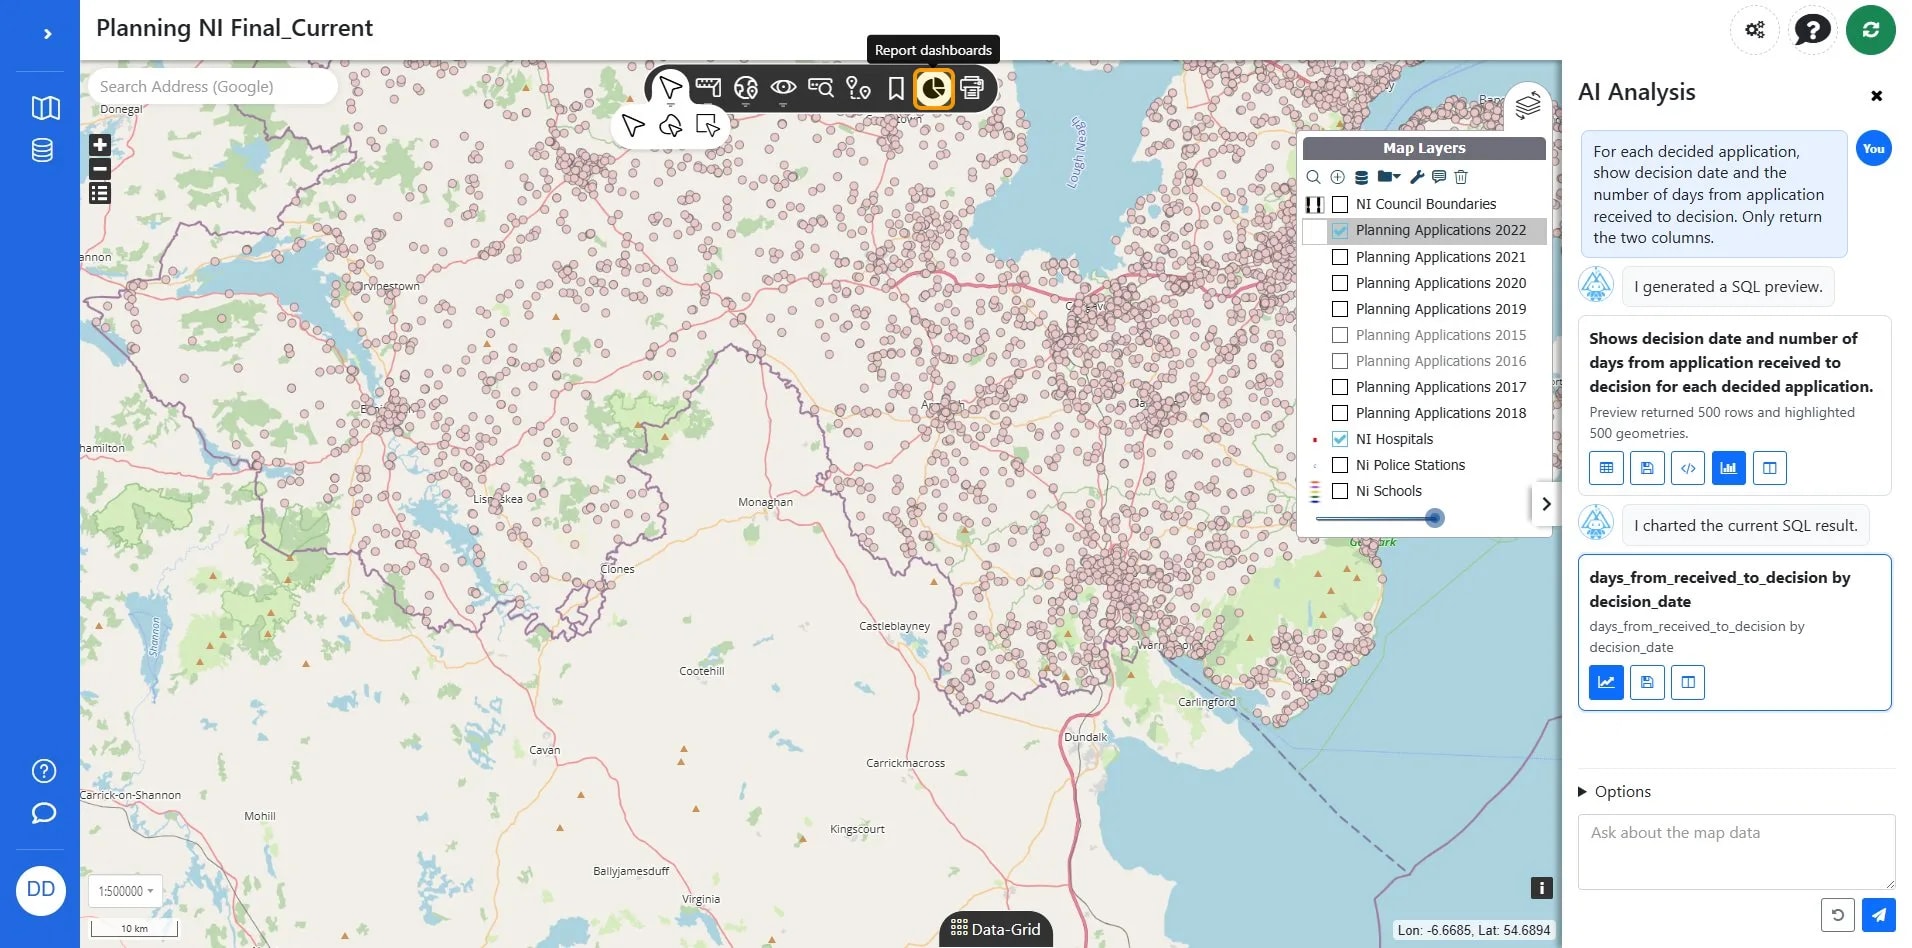
TipBeacuse we saved analysis to the map when we create a new Dashboard it will automatically create it with those analysis added!
15
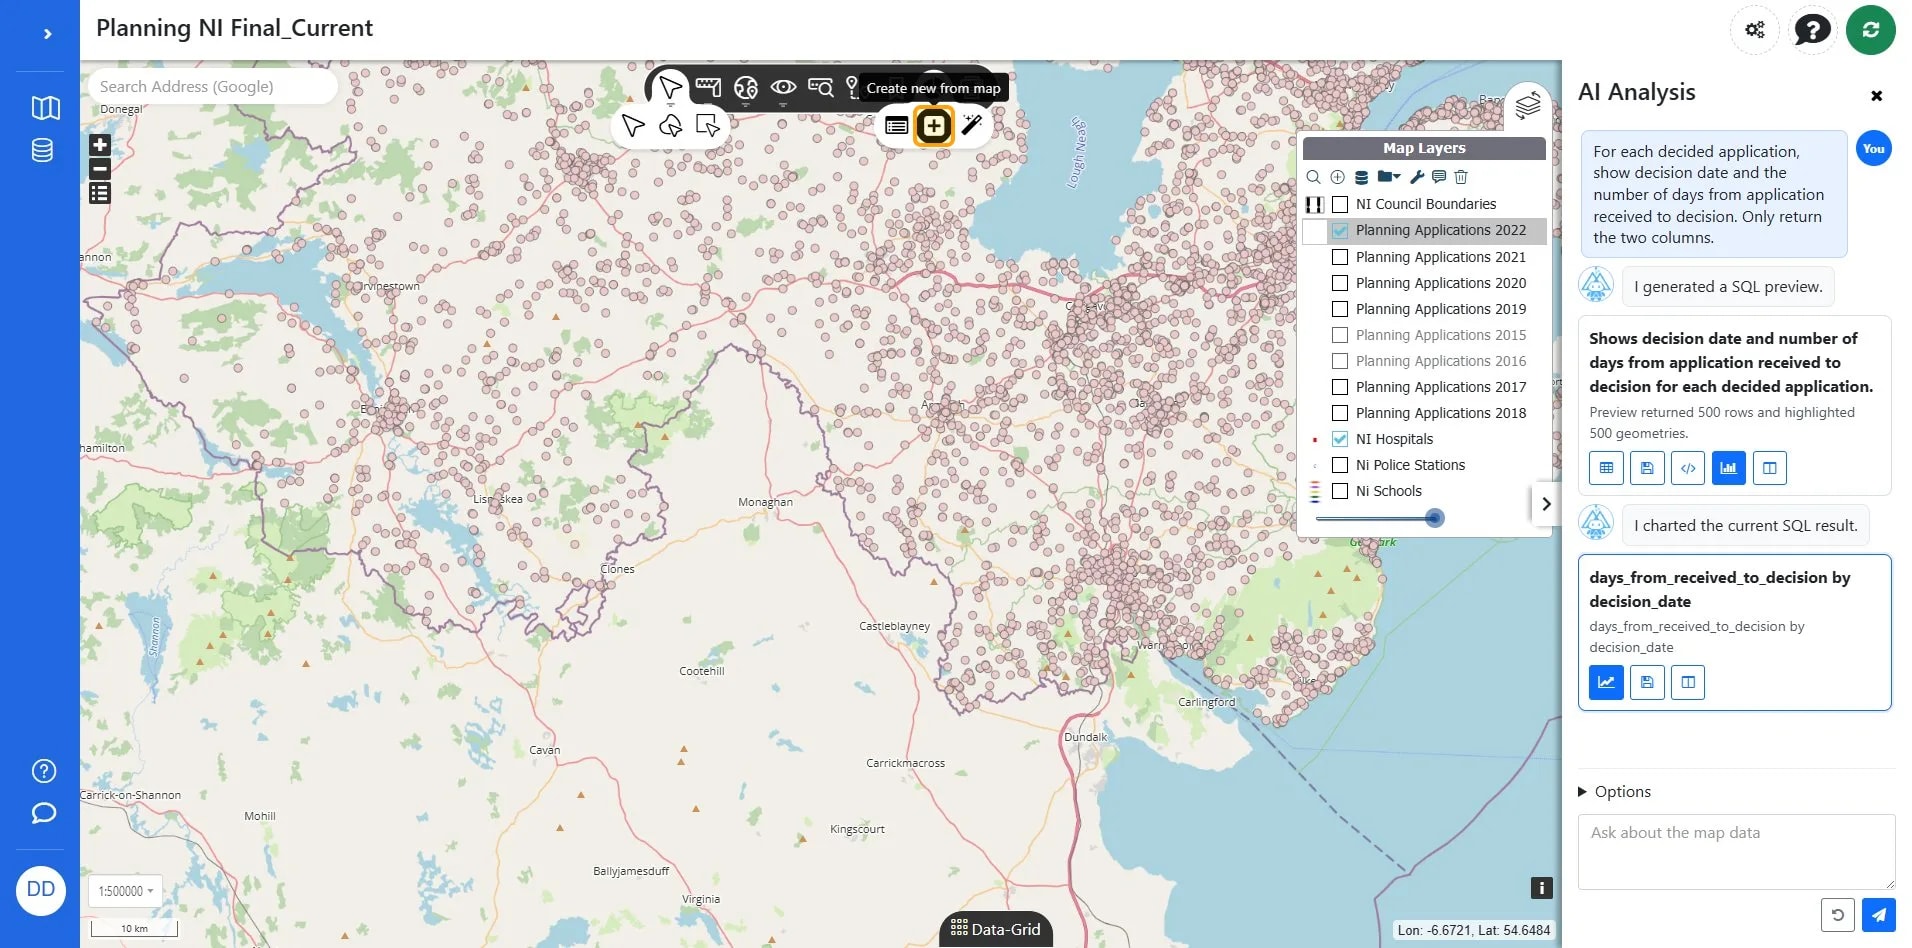
Click the 'Create new from map' button to generate a new report based on the current map view.
16
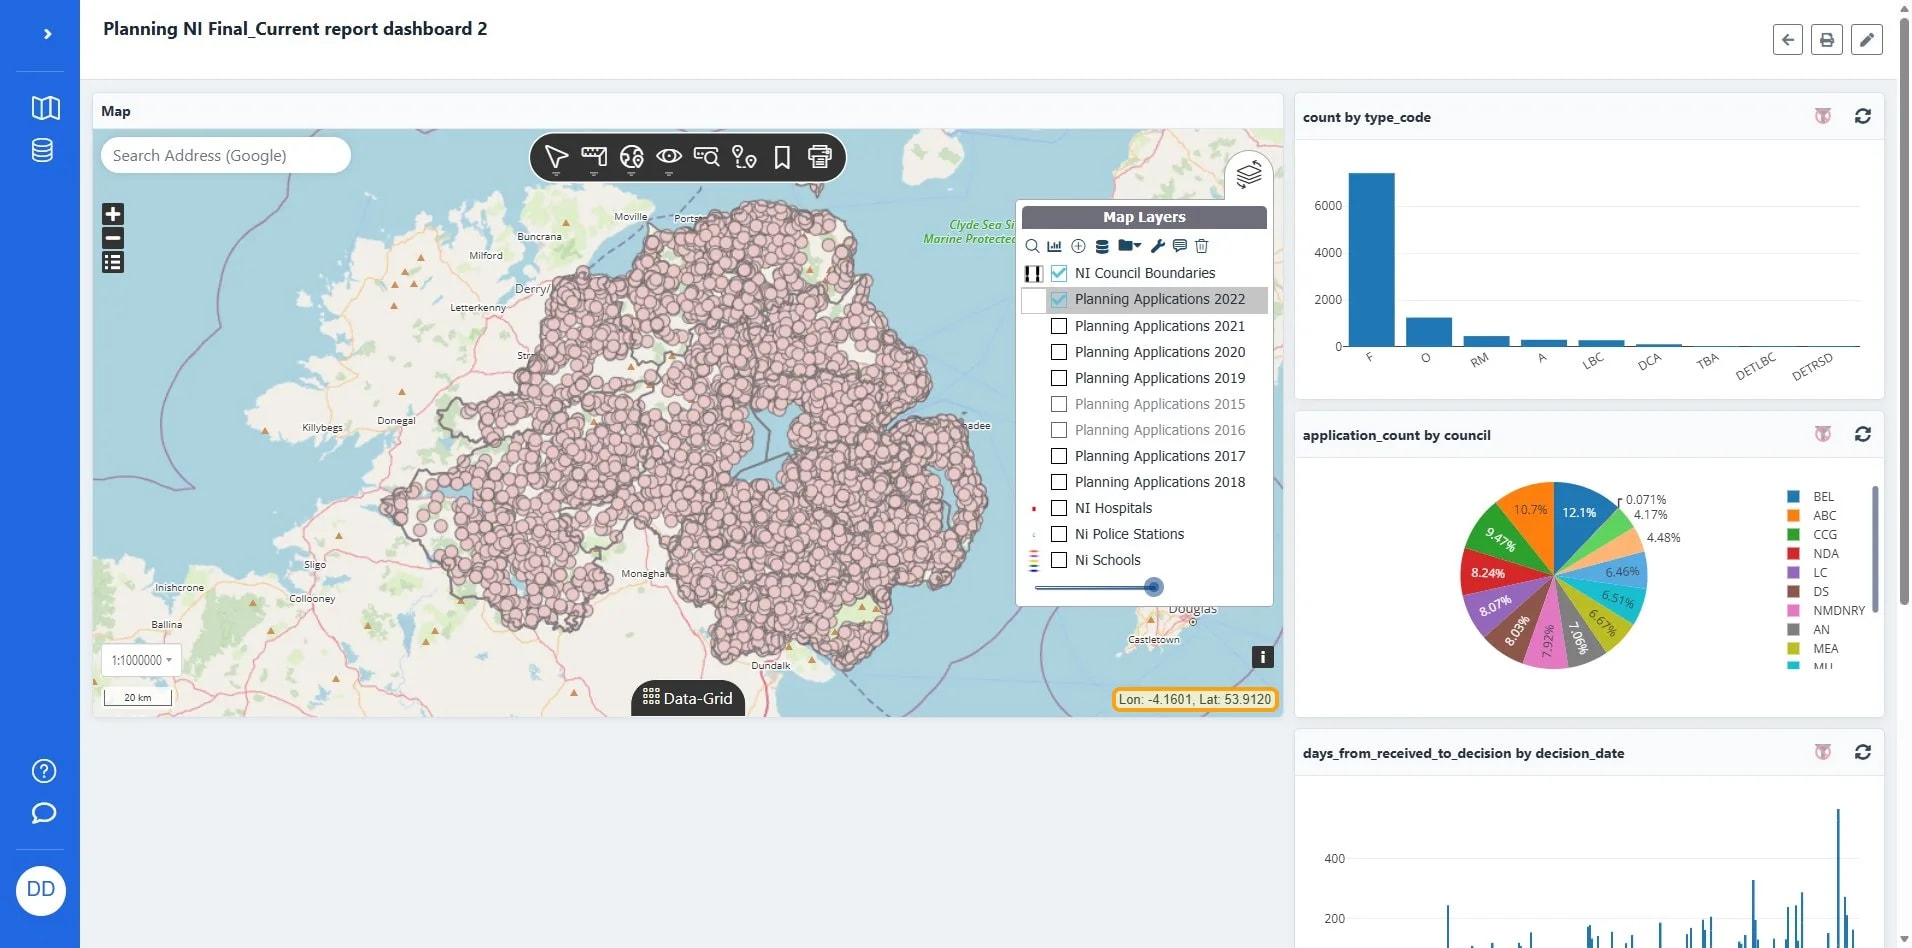
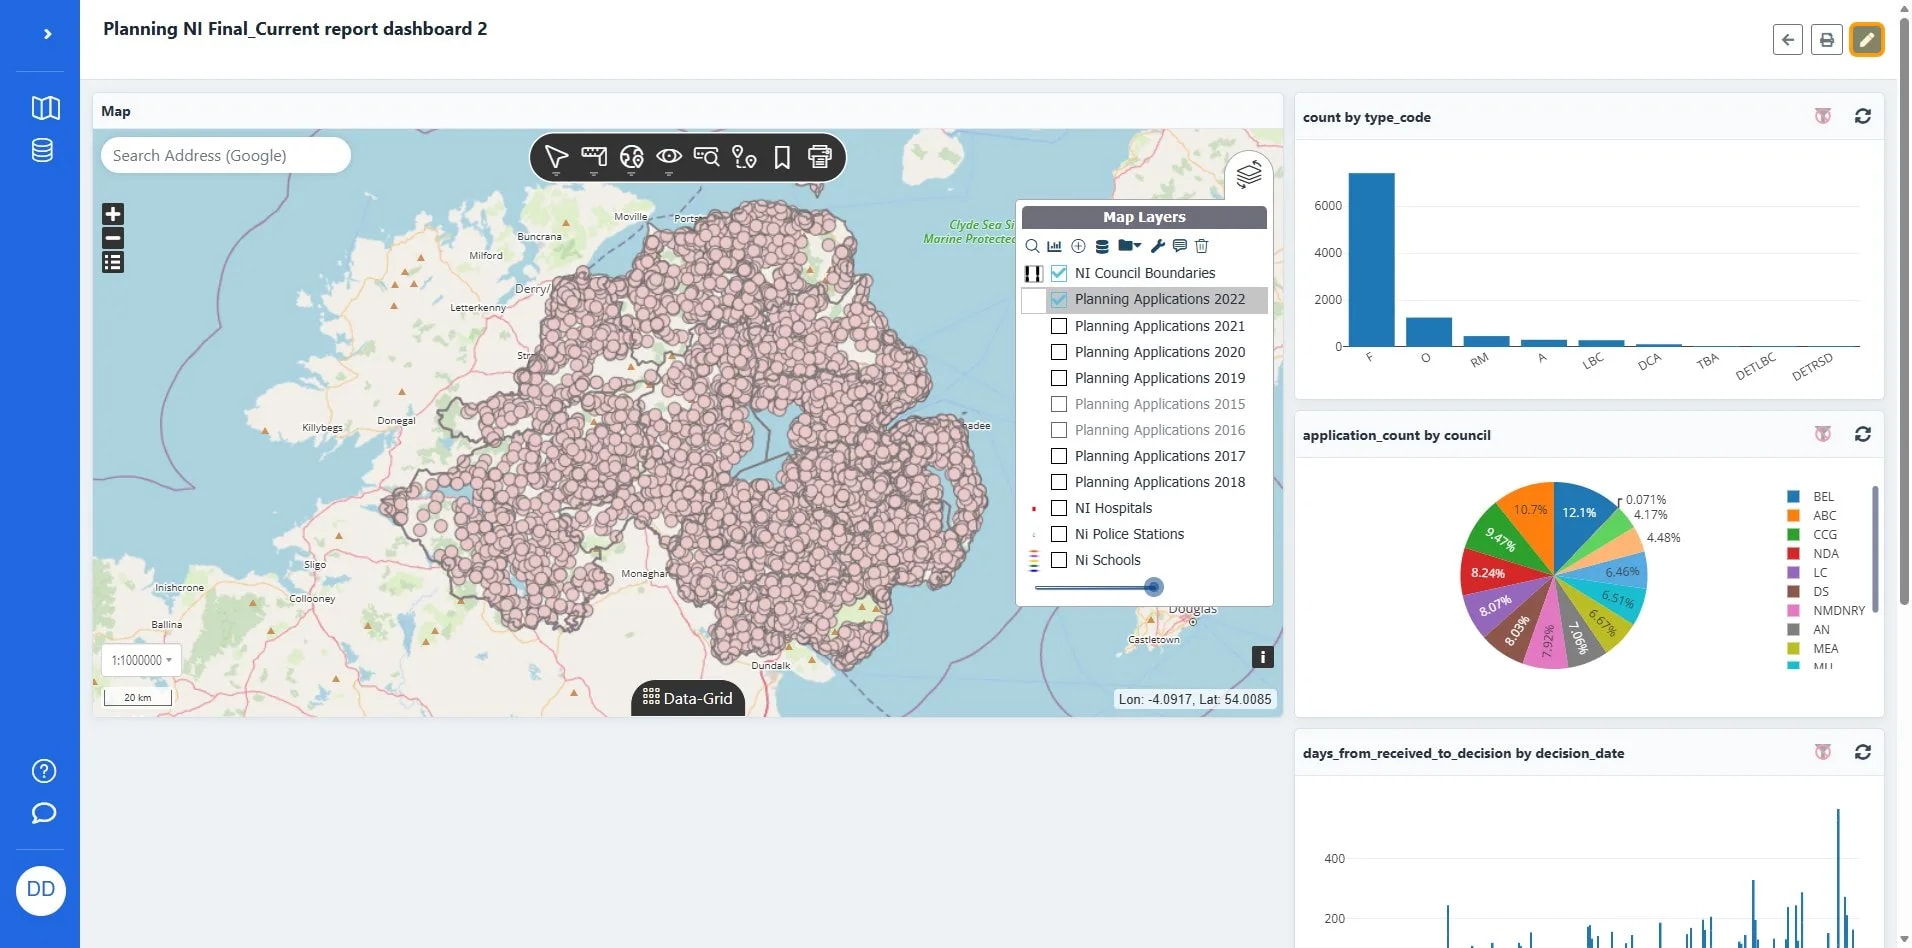
View and reorganise your dashboard
17
Click the Edit dashboard button in the top-right corner to modify the current report dashboard configuration.
18
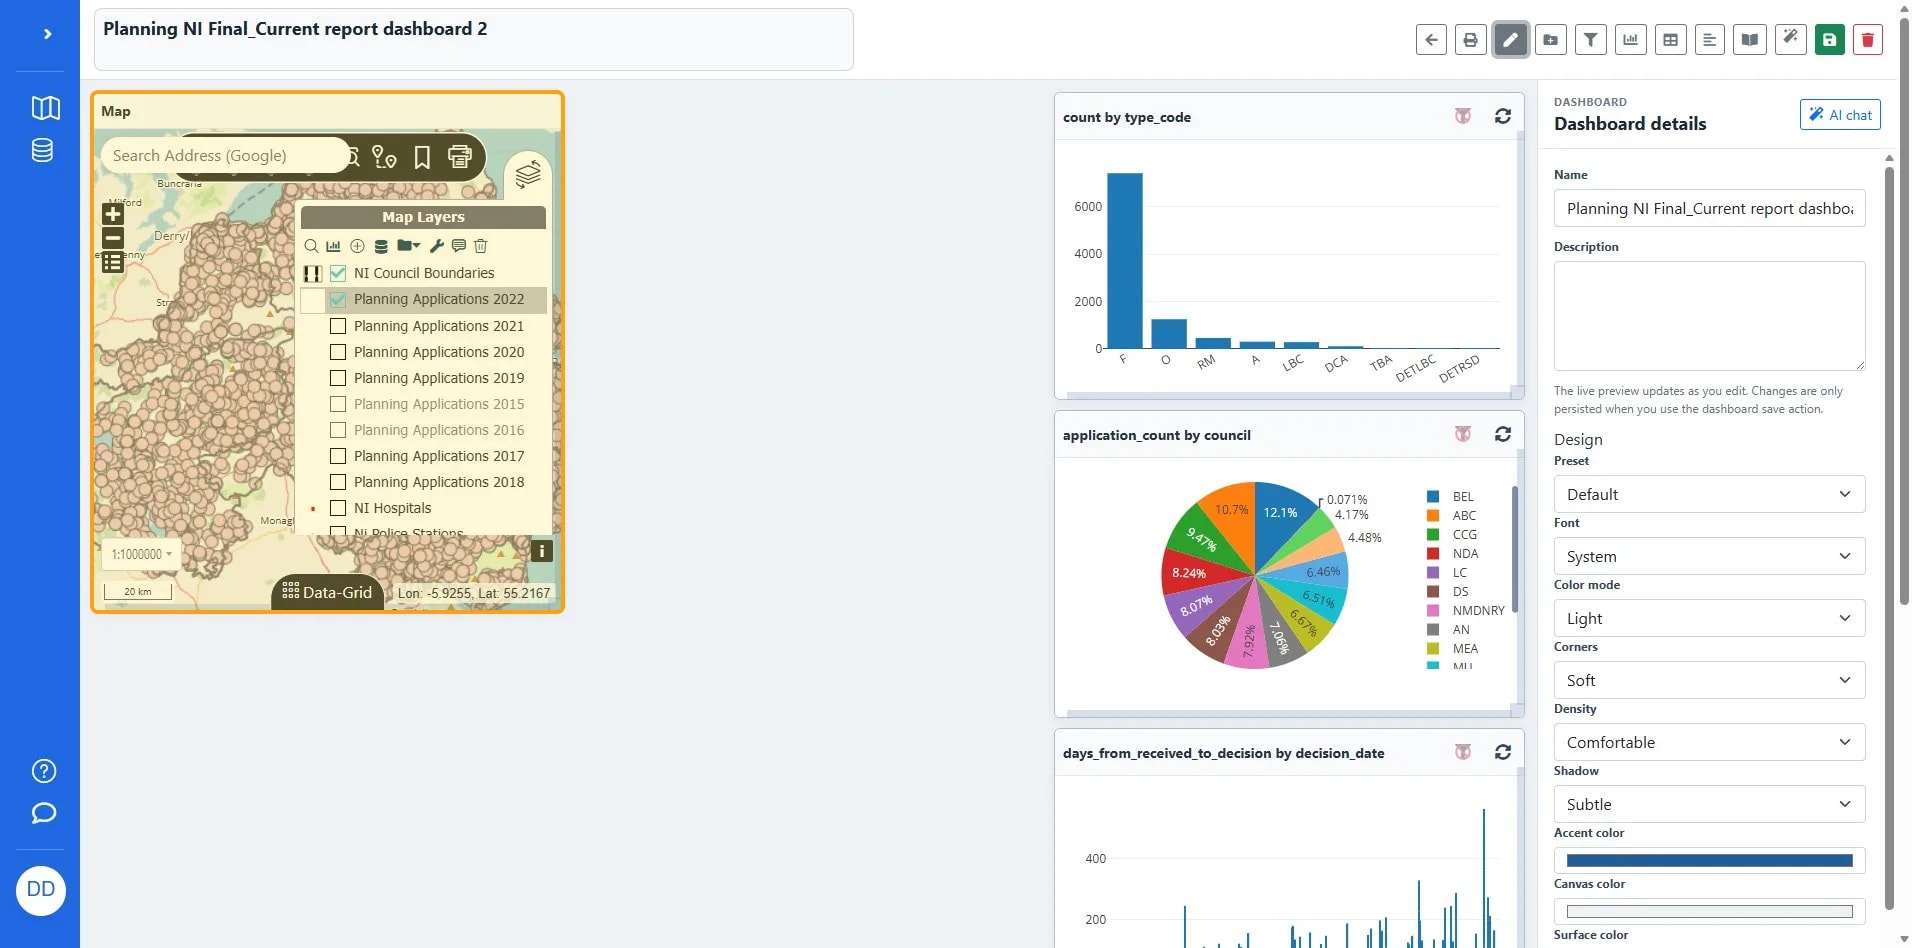
Click on the 'Edit Map' section header to access map configuration options, resize or drag to move.
19
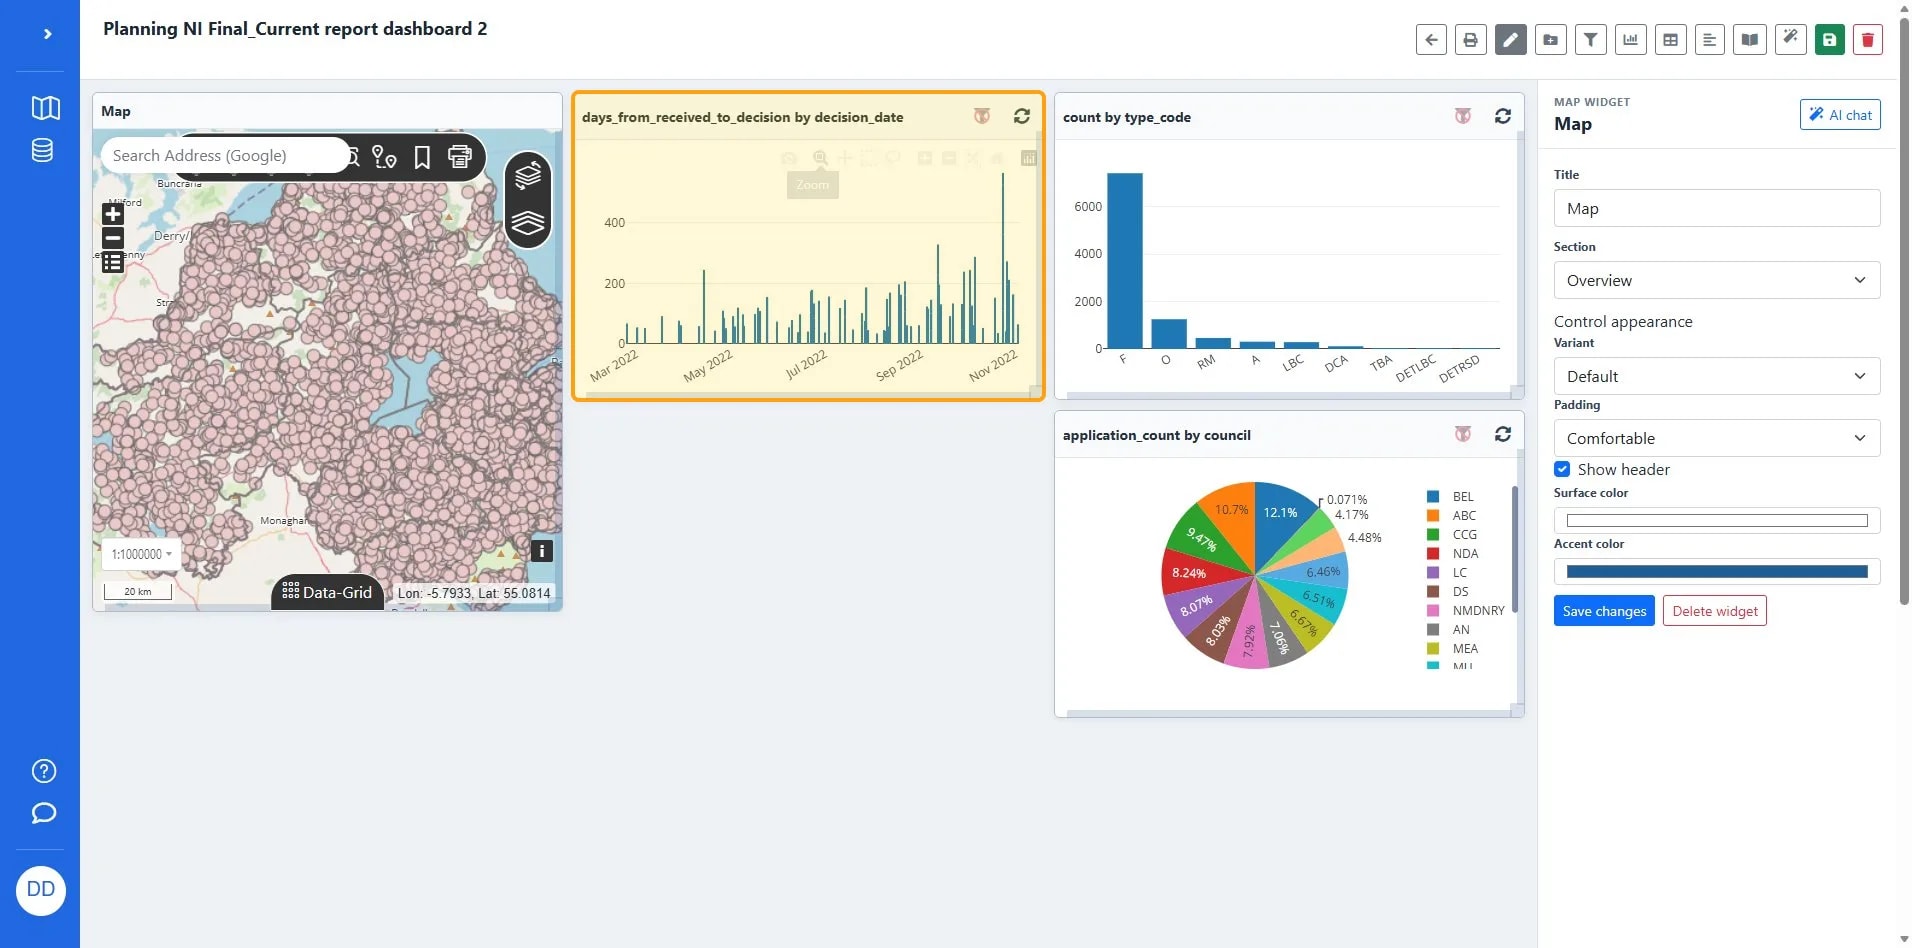
Move it around to your liking
20
Finalize view.
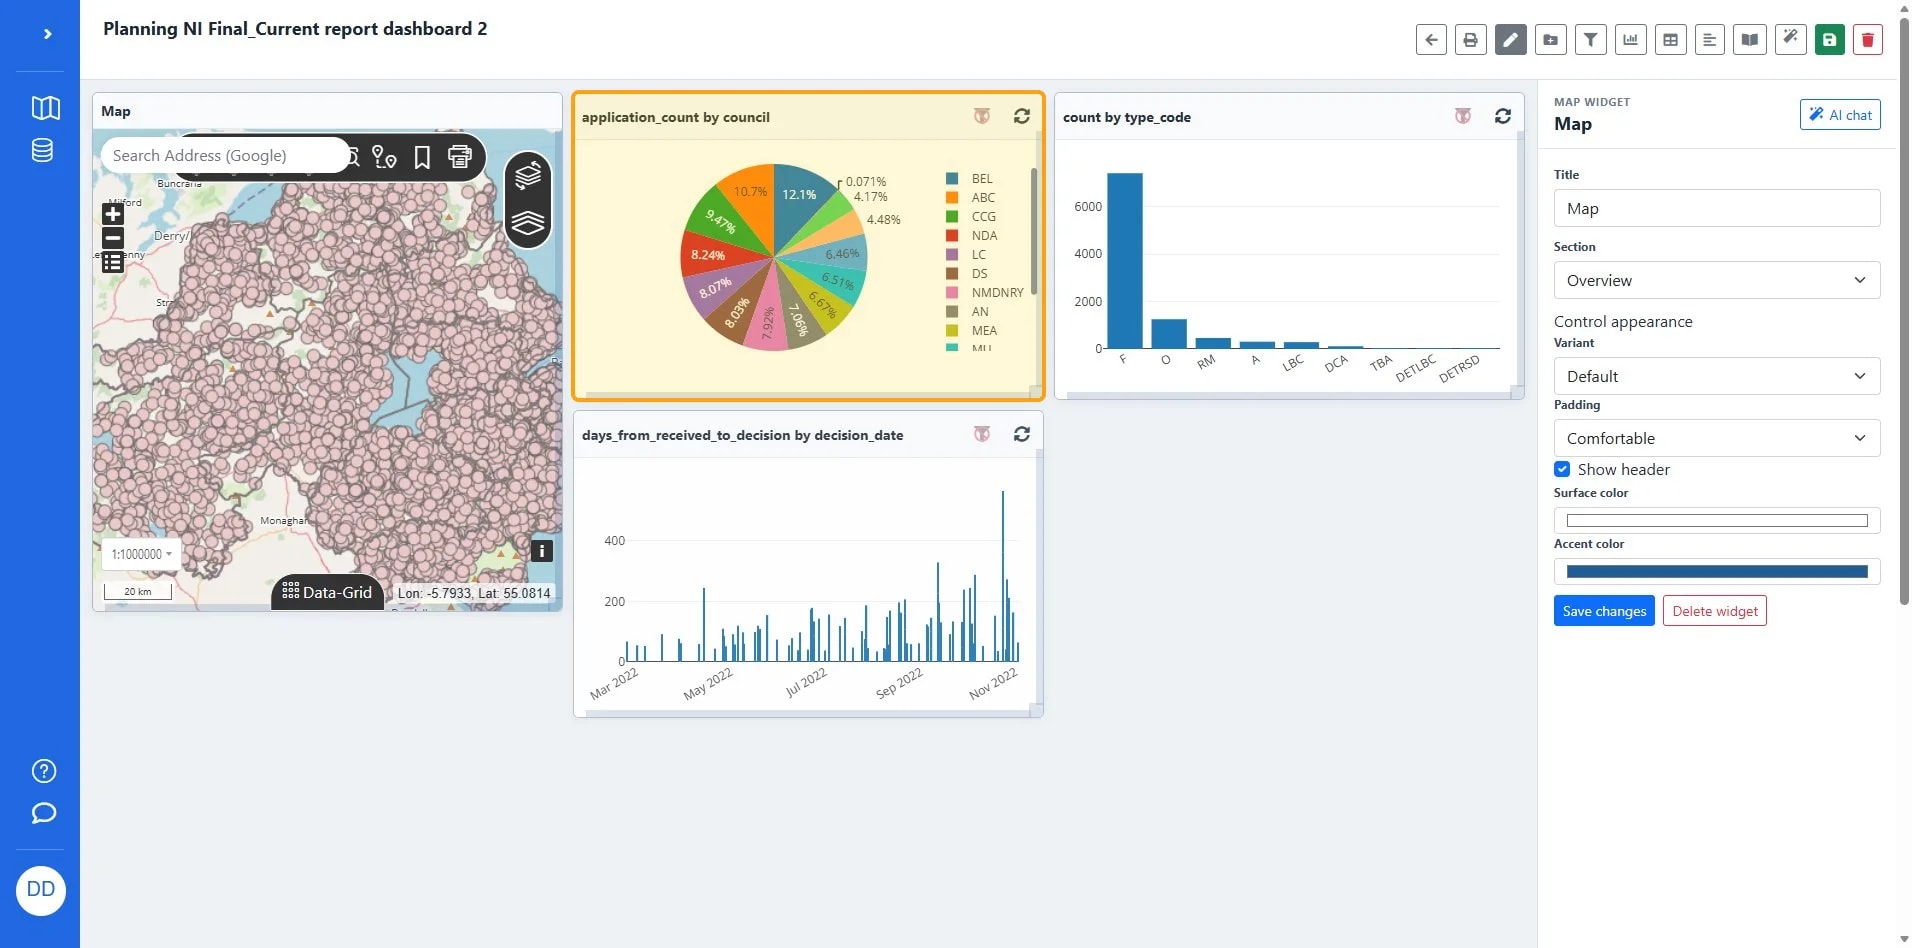
AlertDon't forget to save the dashboard in top right!