Written by:
Naimh
Last updated: 11/08/2026 14:41:32

This workflow guides users through creating and customizing a chart in the Azimap application. It involves selecting analysis options, configuring chart layers, and generating visualizations for planning data.

1

Click Analysis.

Analysis on Planning NI Final_Current | Azimap
2

Click Chart analysis.

Chart analysis on Planning NI Final_Current | Azimap
3

Click 'Describe a chart' to define the characteristics of your new visualization.

Button labeled 'Describe a chart' selected for creating a custom chart description
4

Select desired charting layer

Layer: on Planning NI Final_Current | Azimap
5

Help for AI sample values

Close button in the Sample values modal window
6

Check sample values for beter results.

Use sample values on Planning NI Final_Current | Azimap
7

Describe your chart and hit generate.

nlChartGenerateBtn on Planning NI Final_Current | Azimap
8

View your chart

Planning Applications 2022 on Planning NI Final_Current | Azimap
9

Click the Close button in the top-right corner of the chart preview to dismiss it.
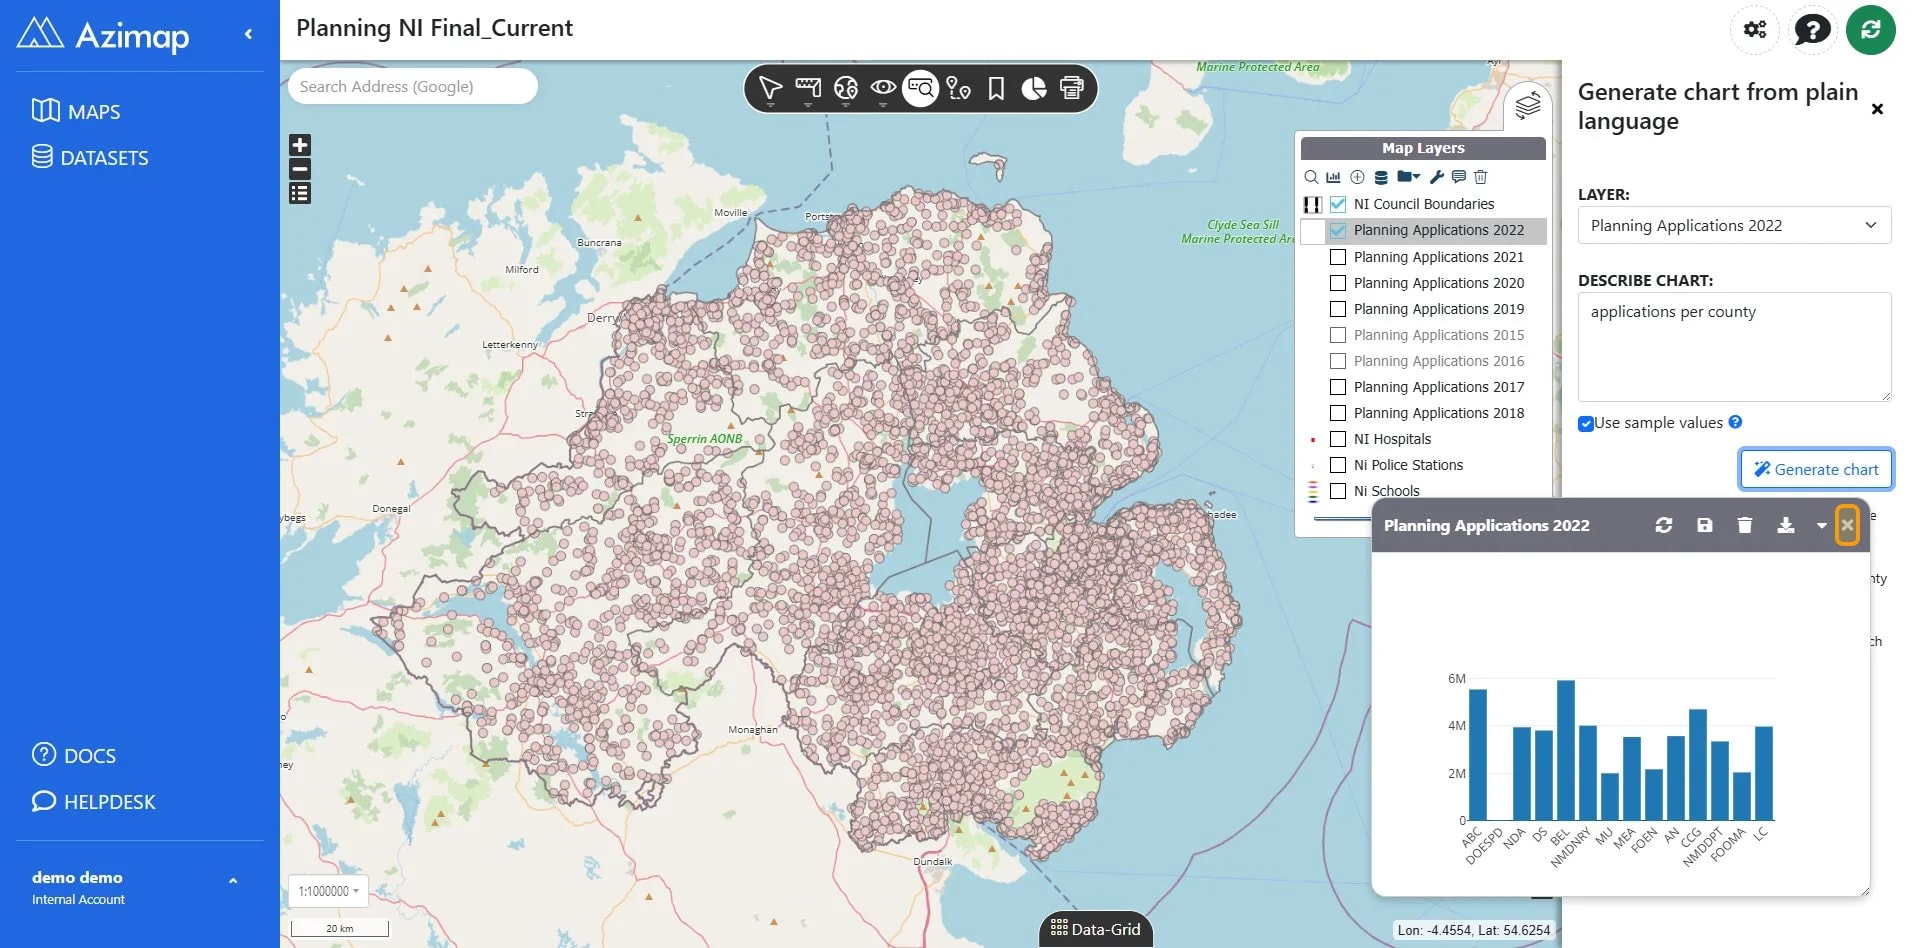
Button labeled 'Close' with an X icon, located at the top-right of the chart preview panel.