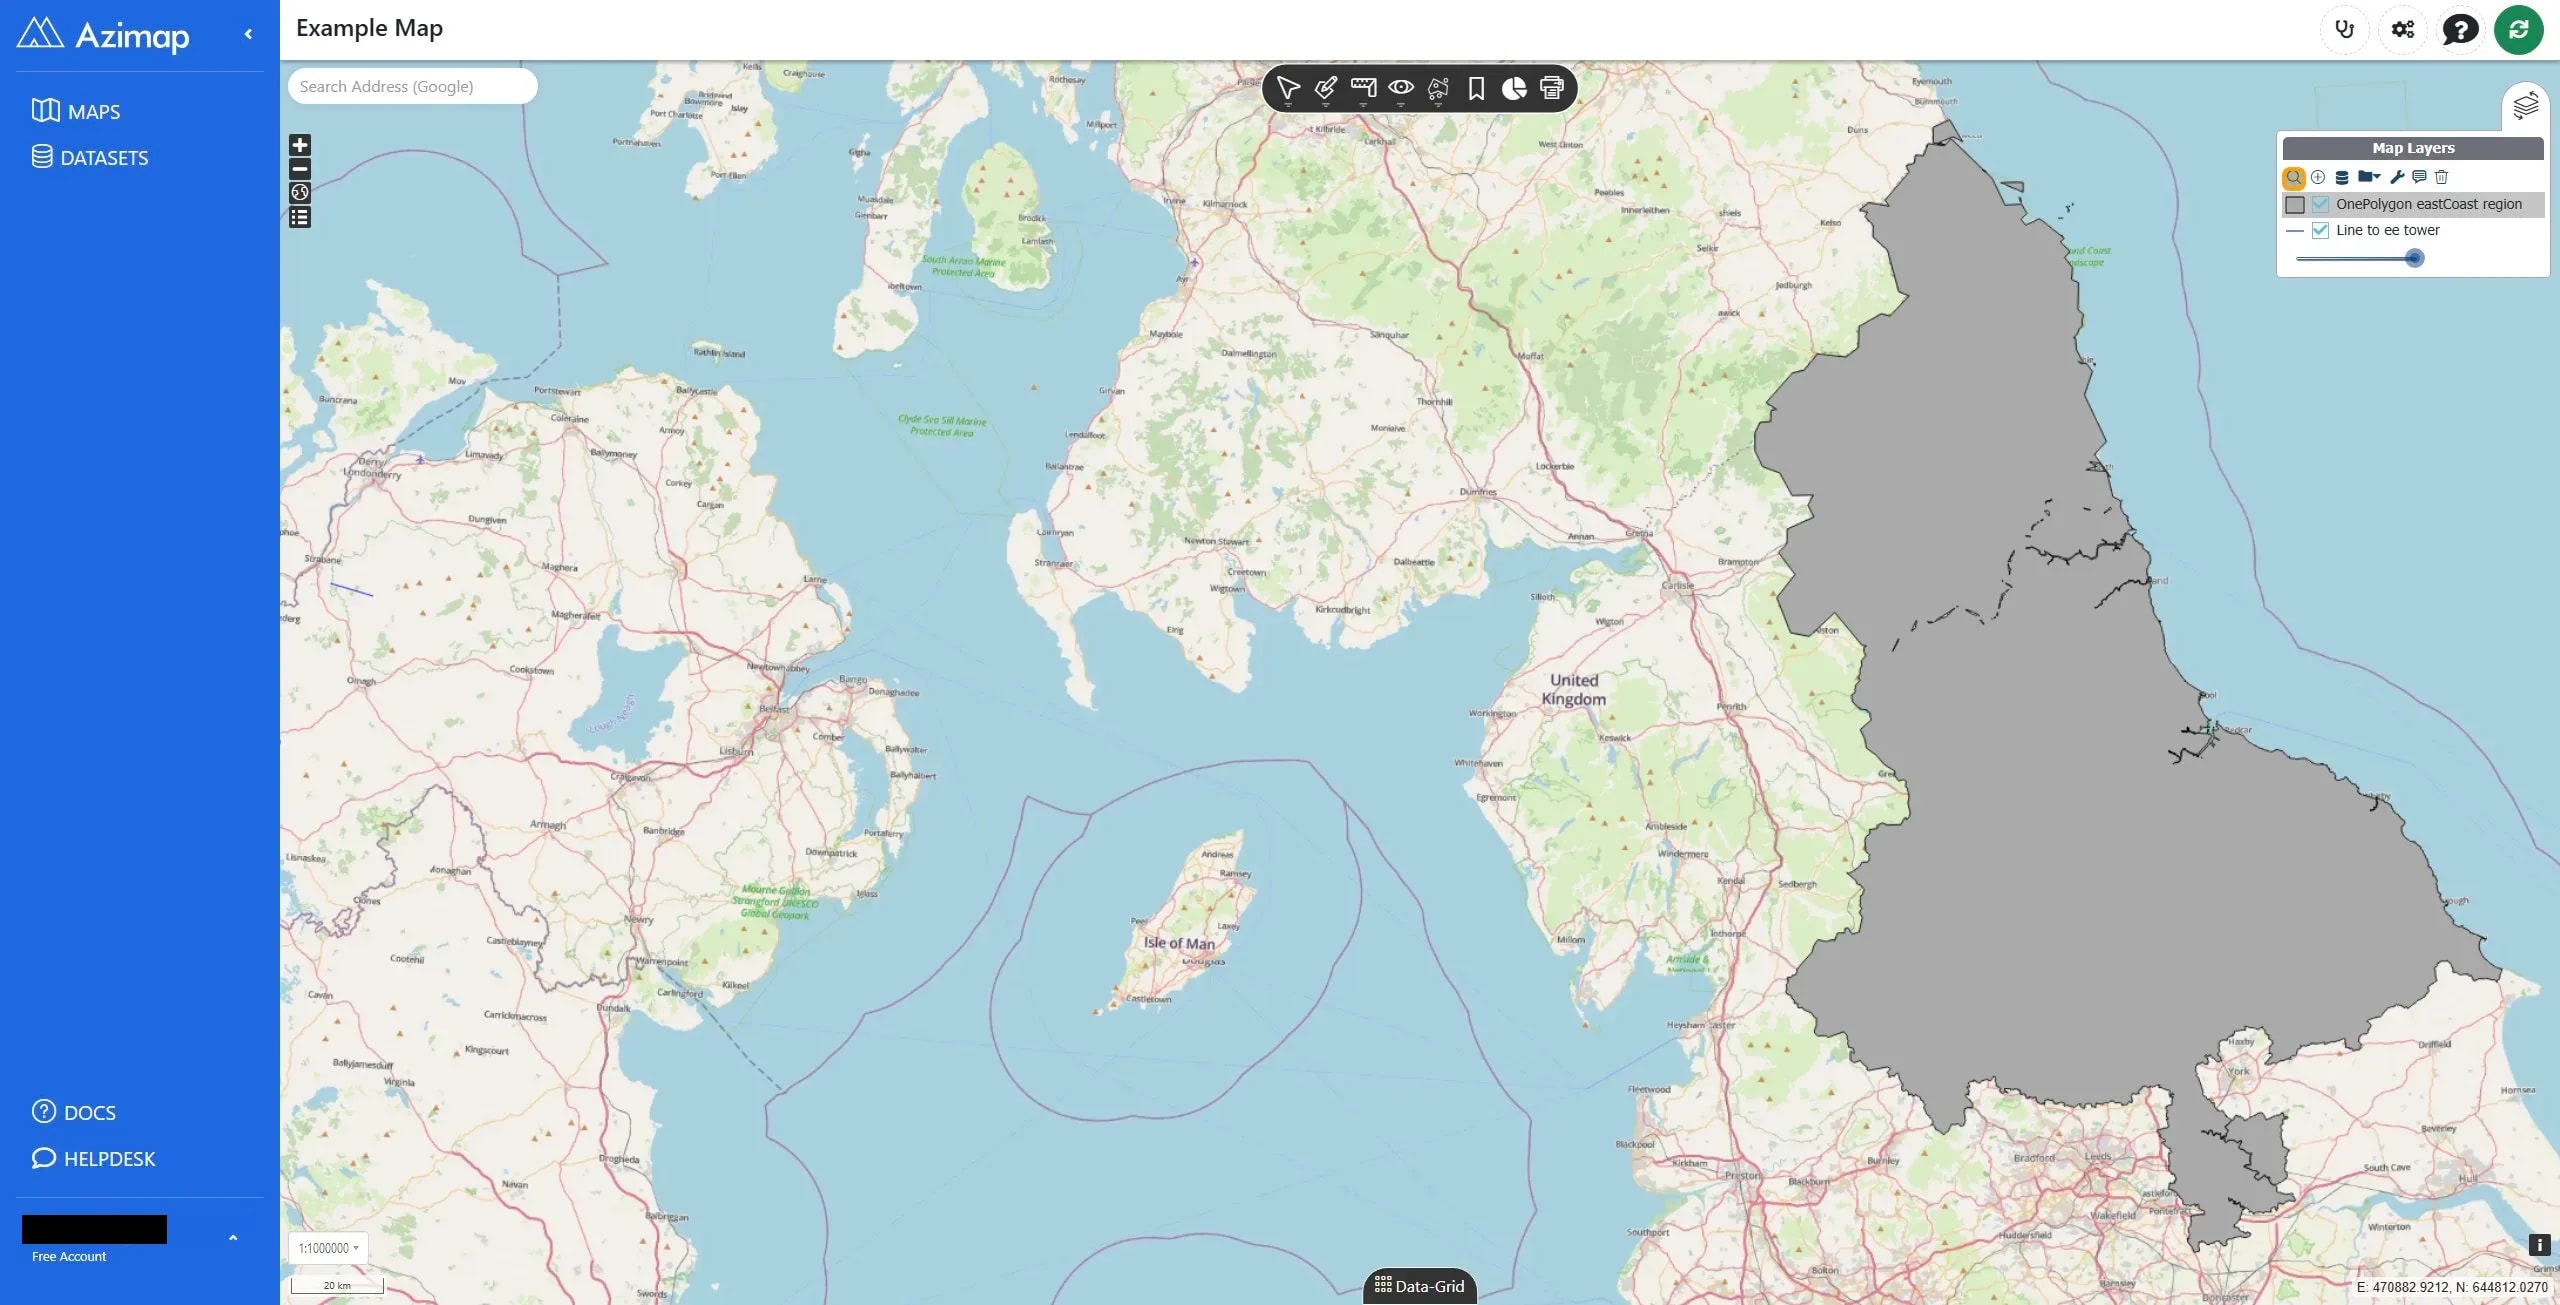
This workflow guides users through creating a new map in Azimap by selecting a coordinate system, choosing datasets, enabling visualization tools, and finalizing the map with editing and zoom features.
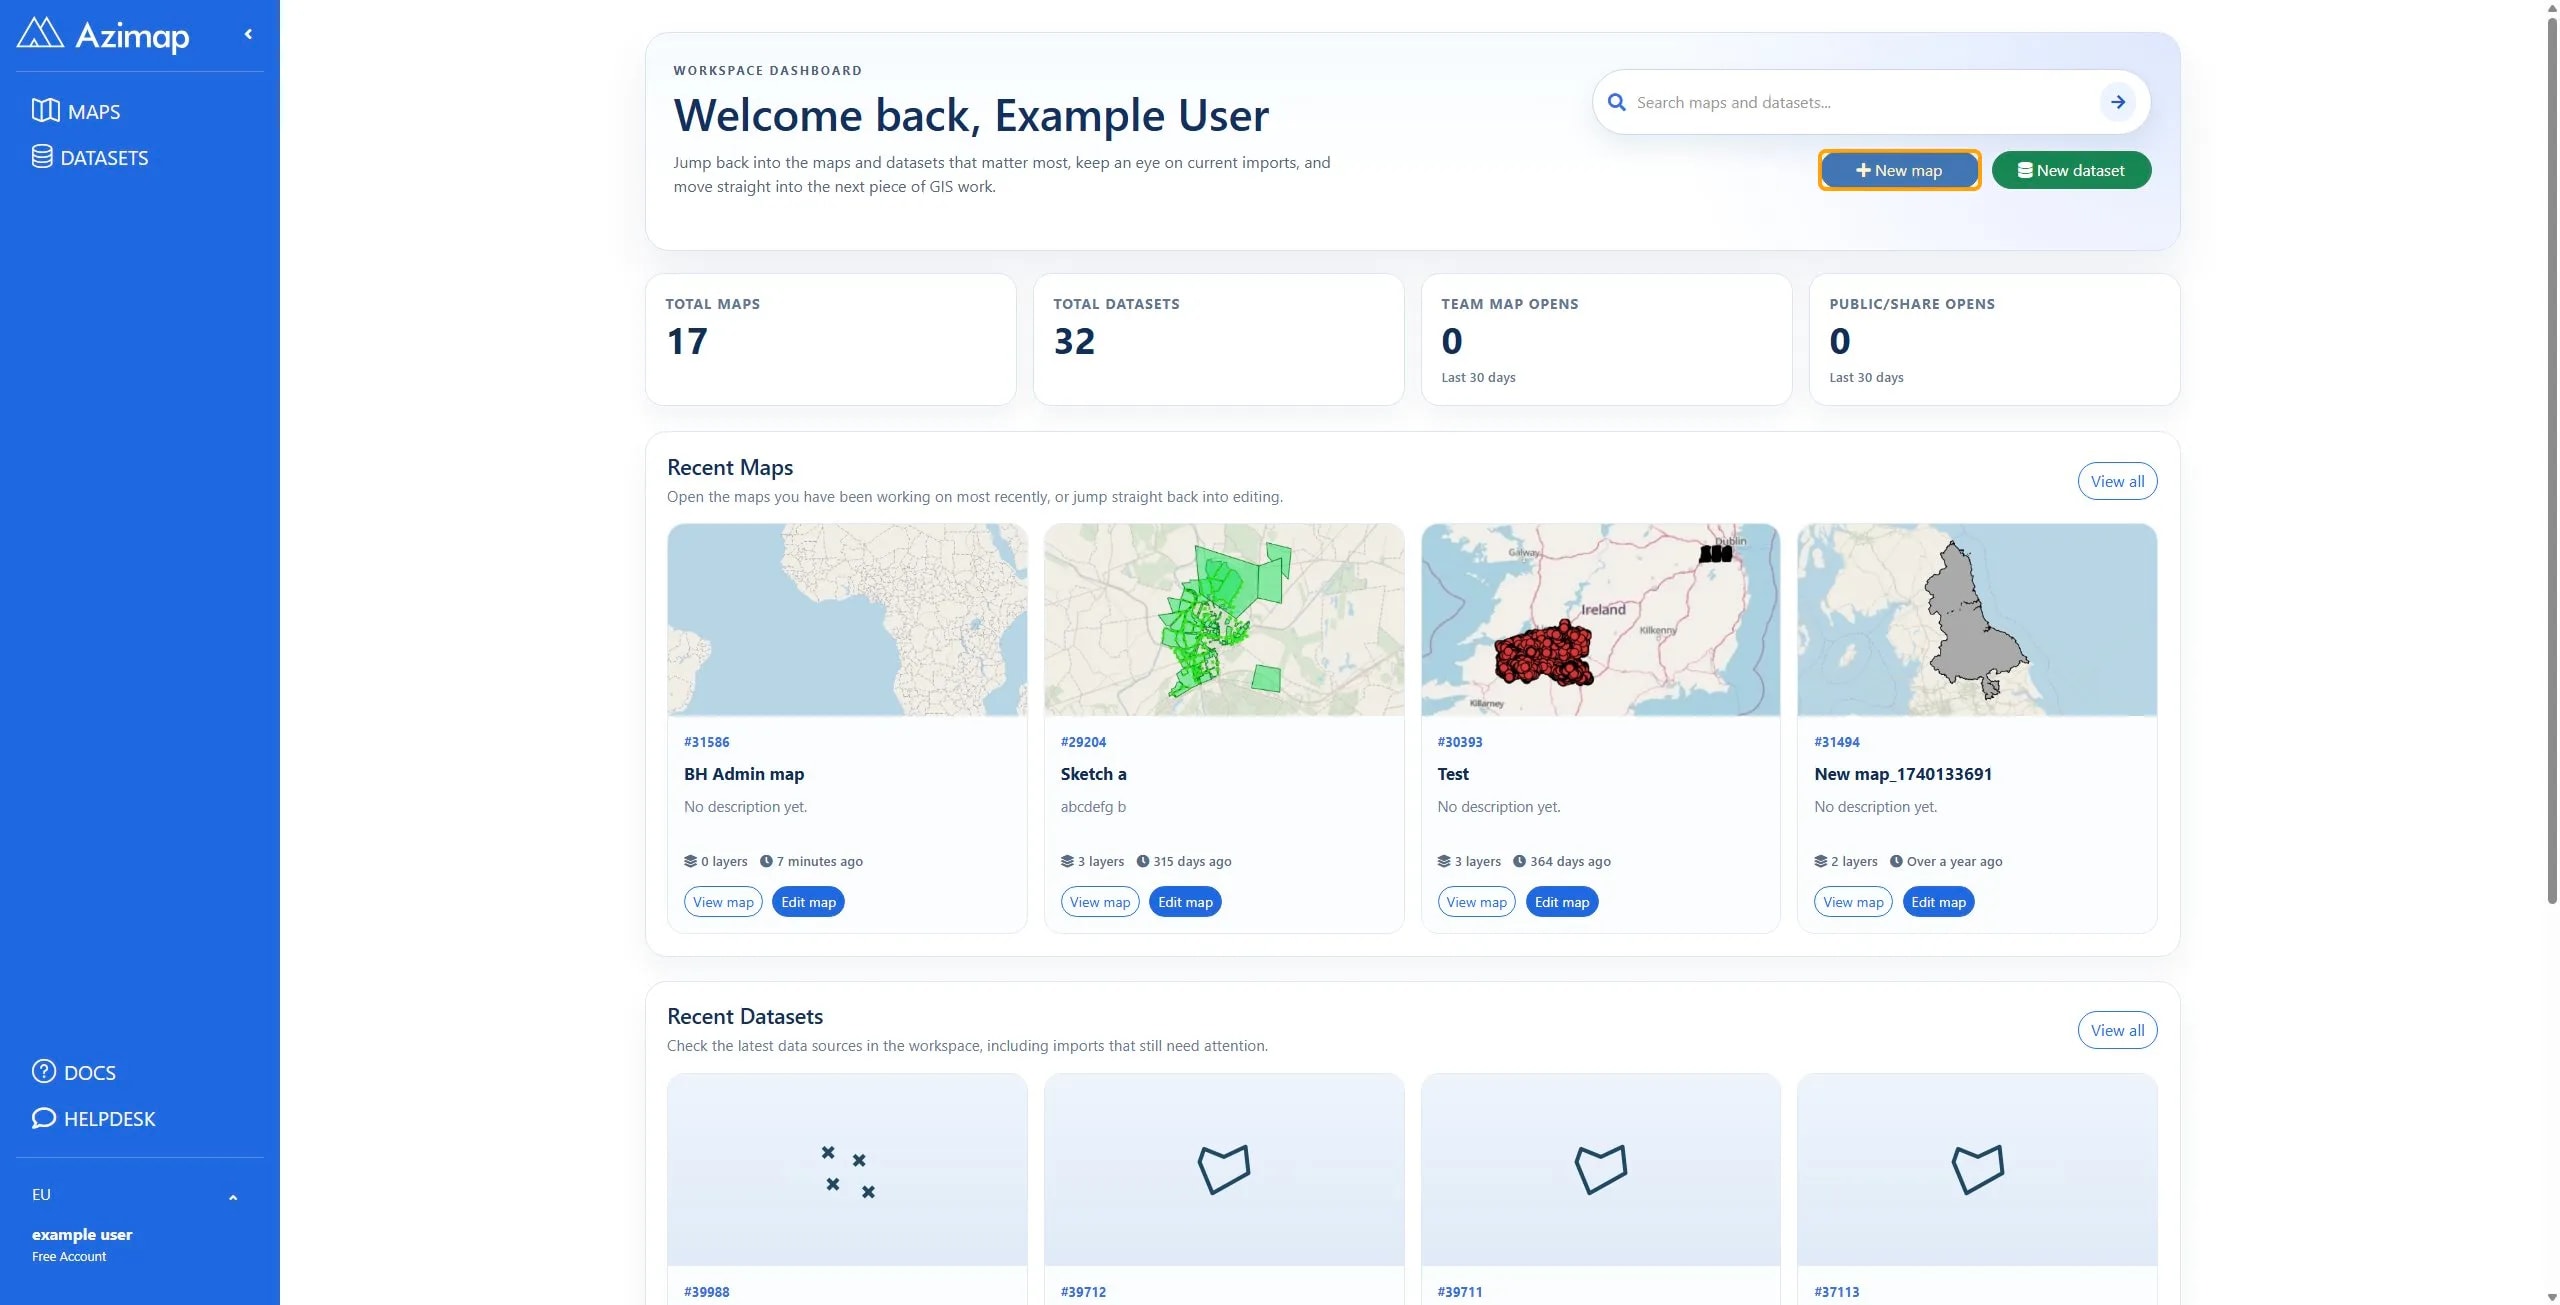
TipYou can create a new map from the Dashboard page or Maps page.
1
Click New map.
2
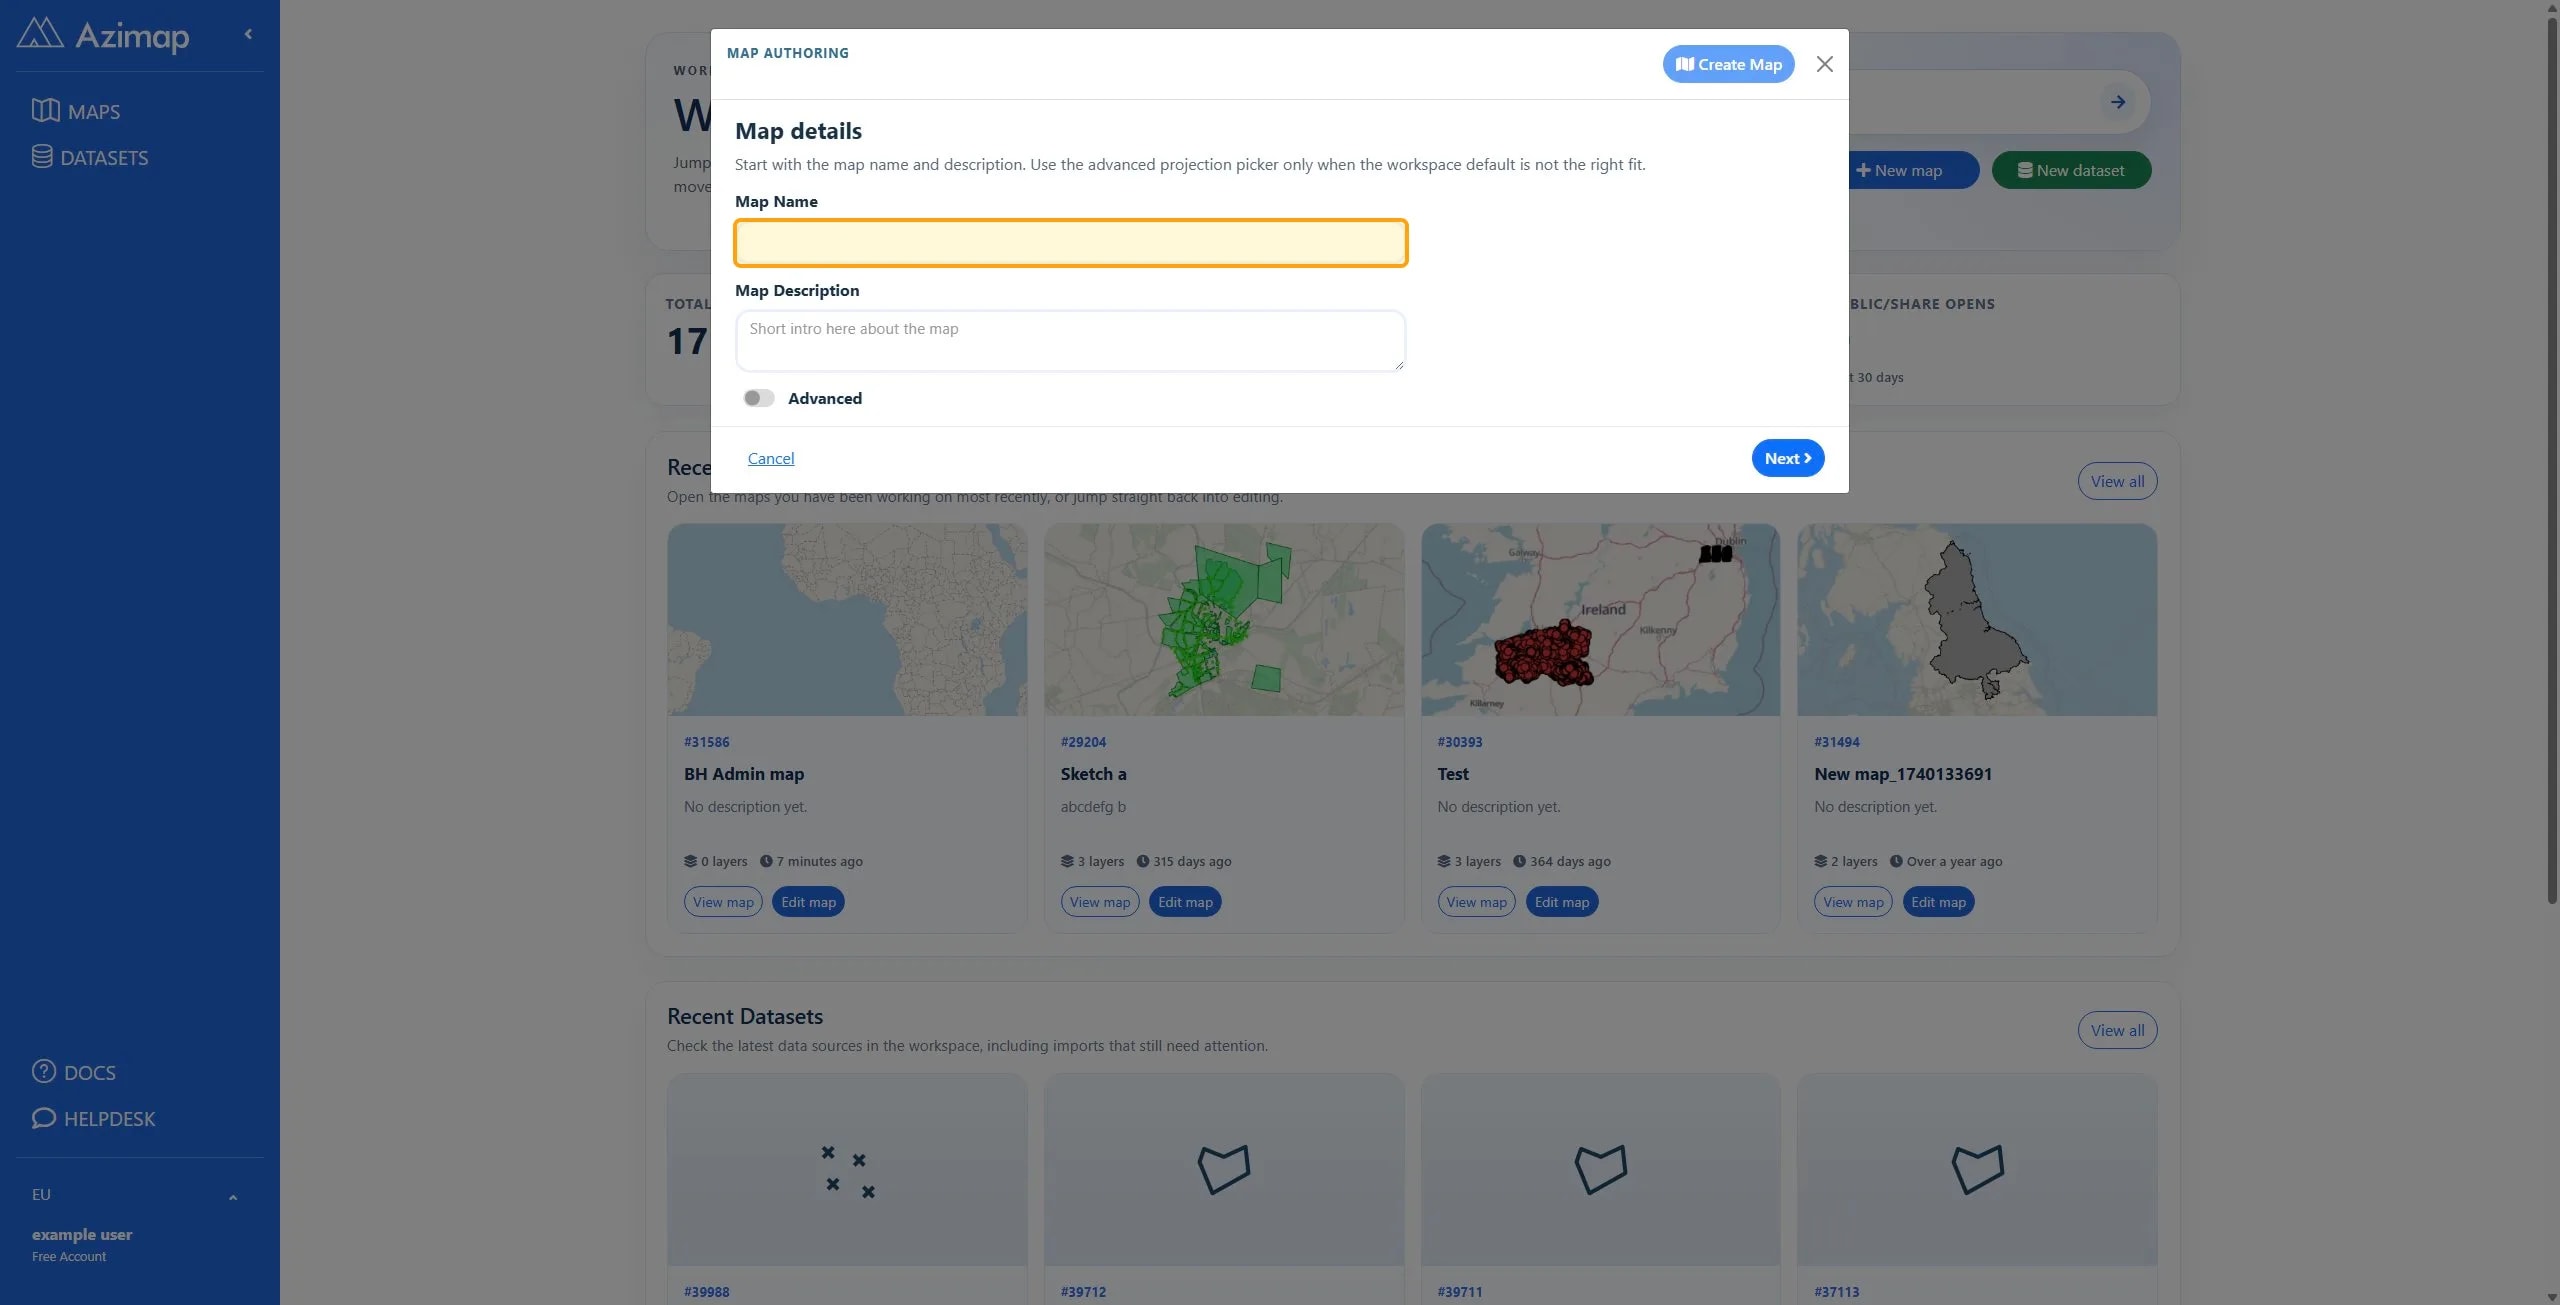
Enter a name for the map.
3
Enter a description for the map (optional).
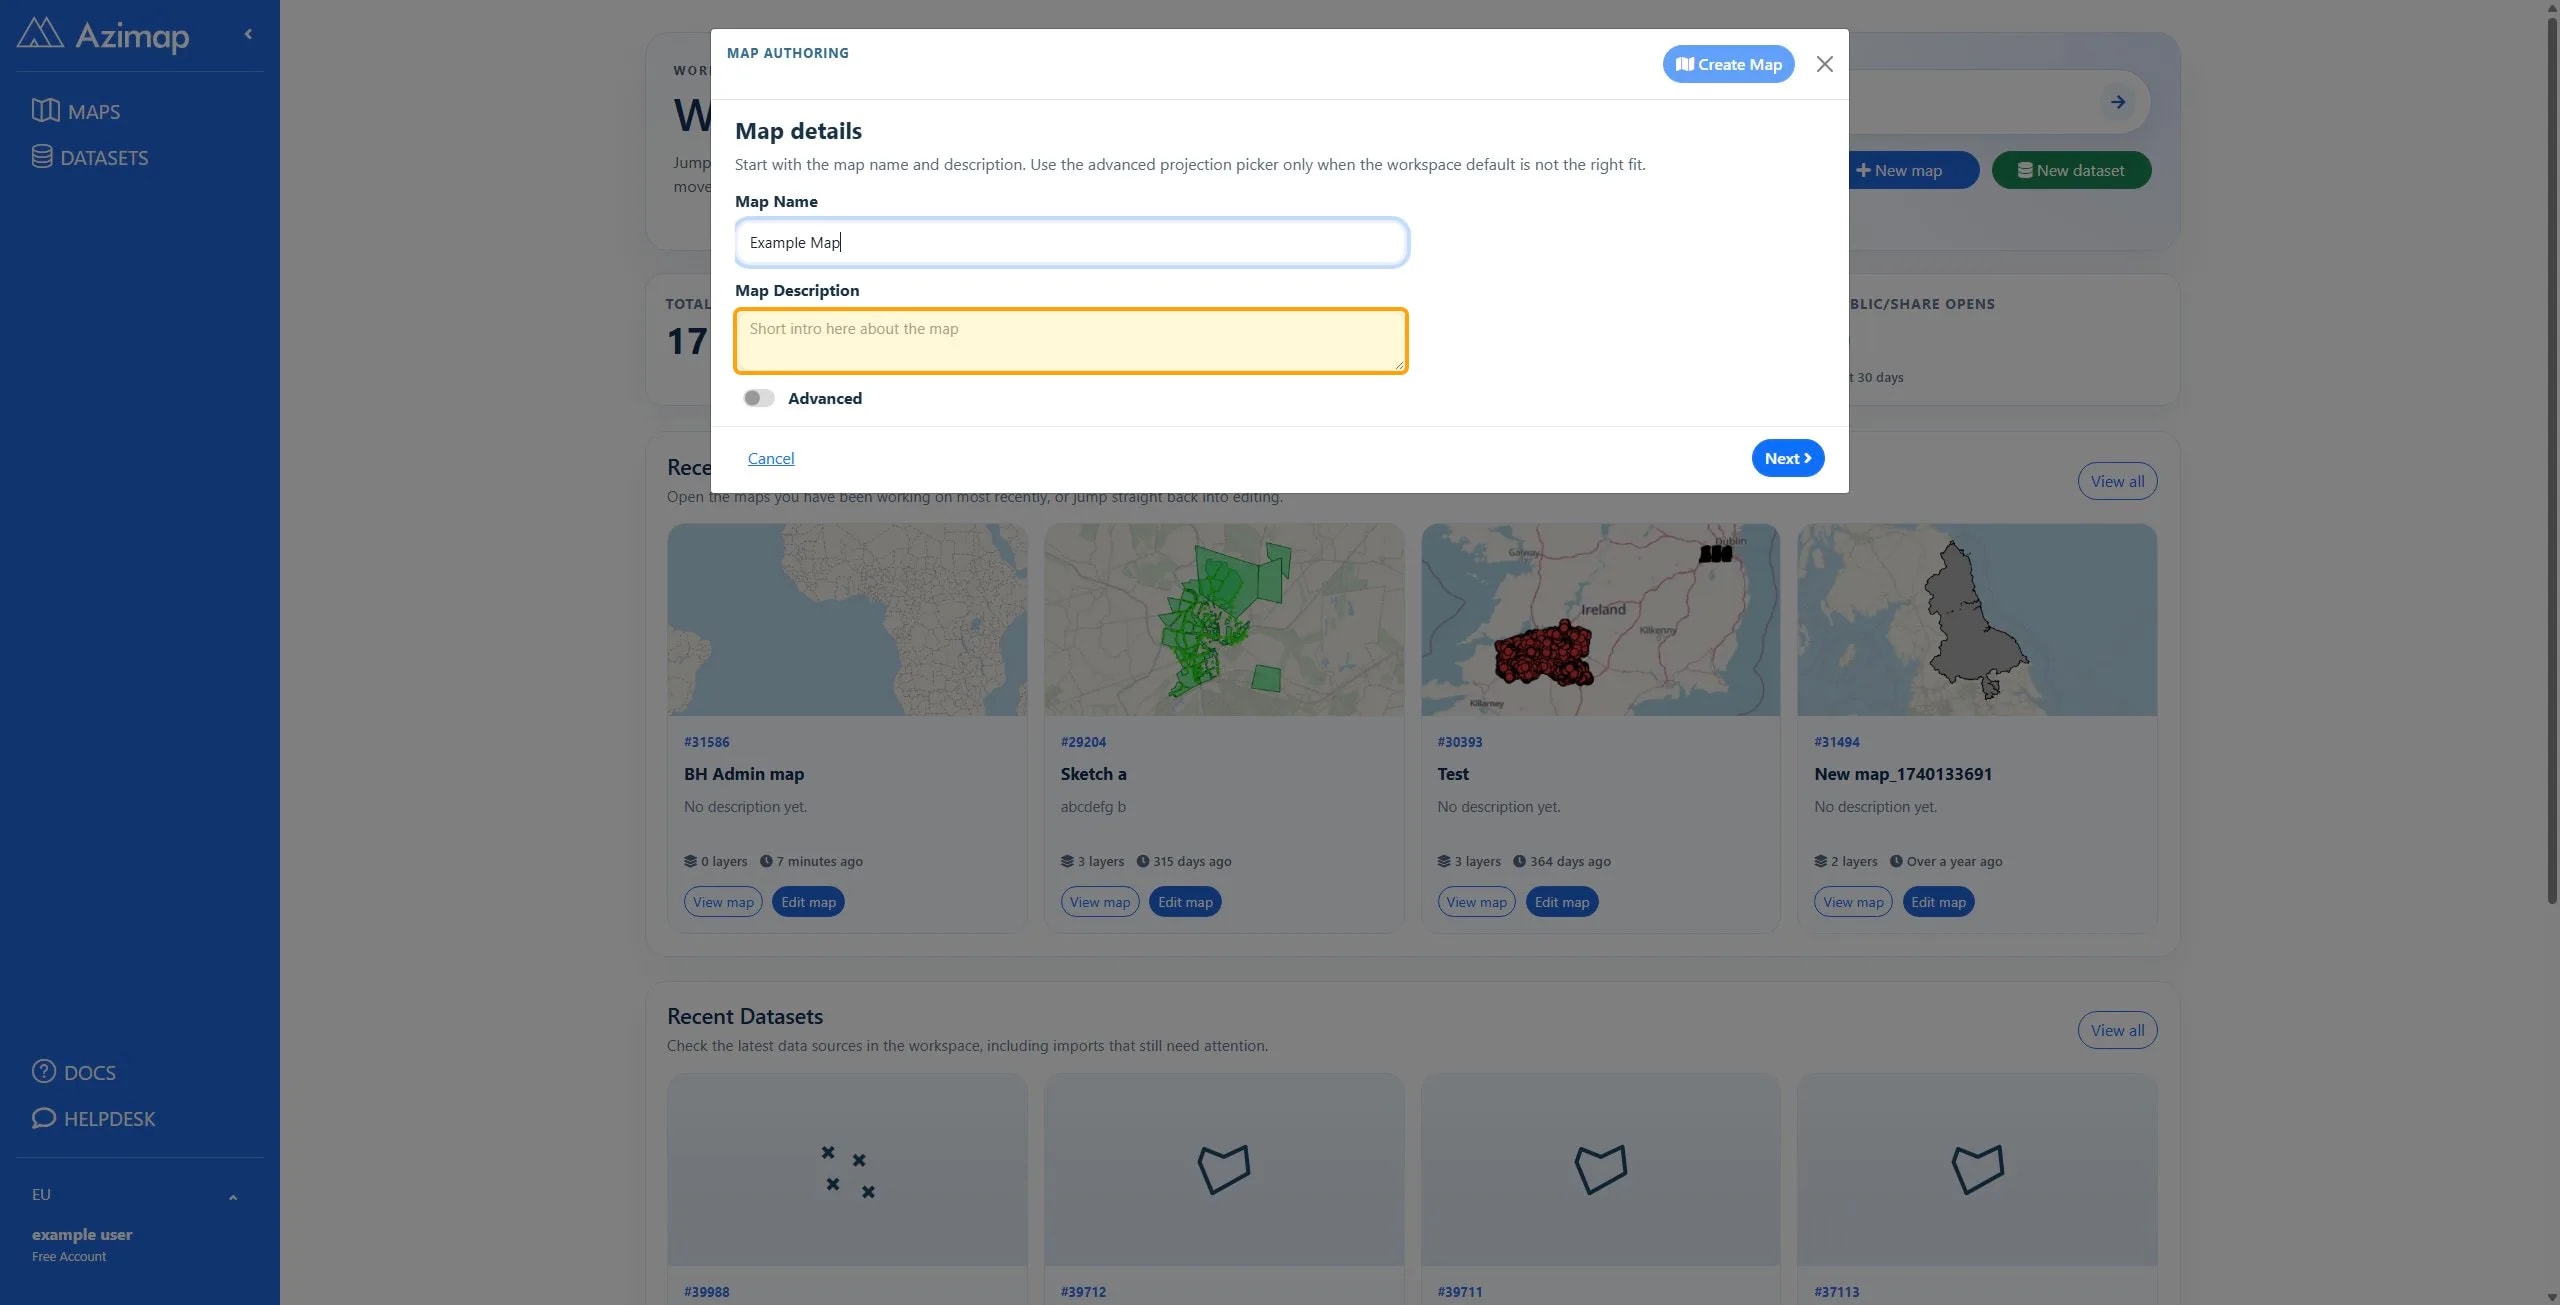
TipThe default projection can be configured in the Administration settings. (By default it is EPSG:3857)
4
(optional) If you wish to set a custom projection select the Advanced option.
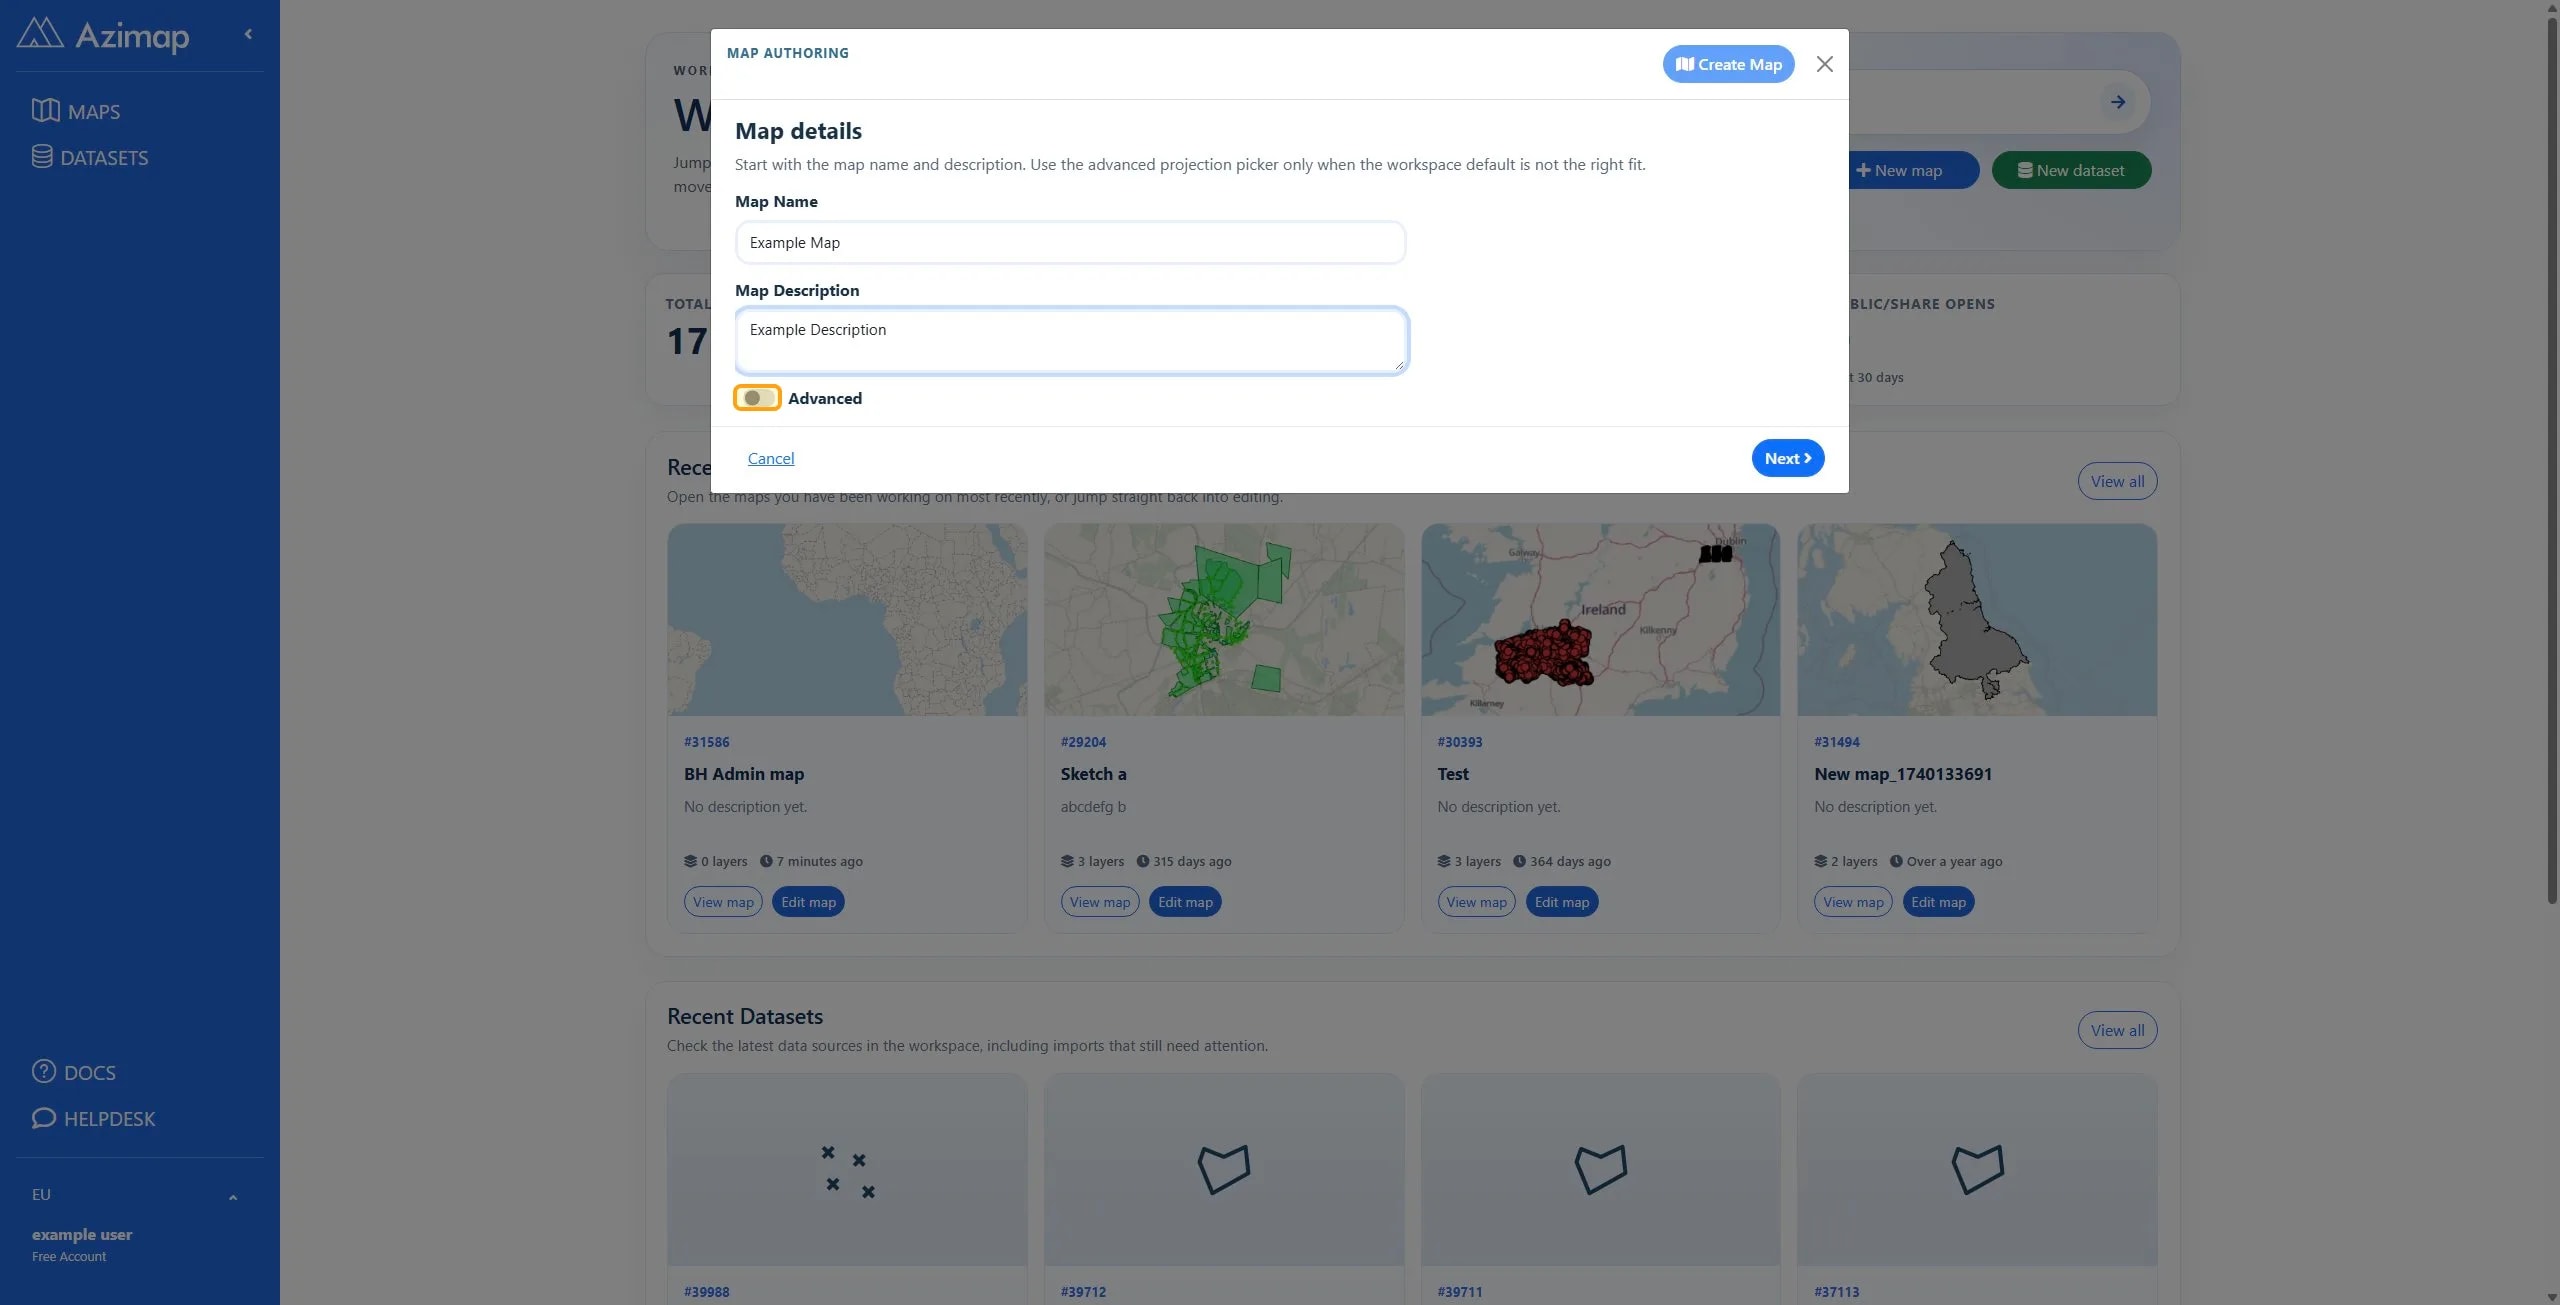
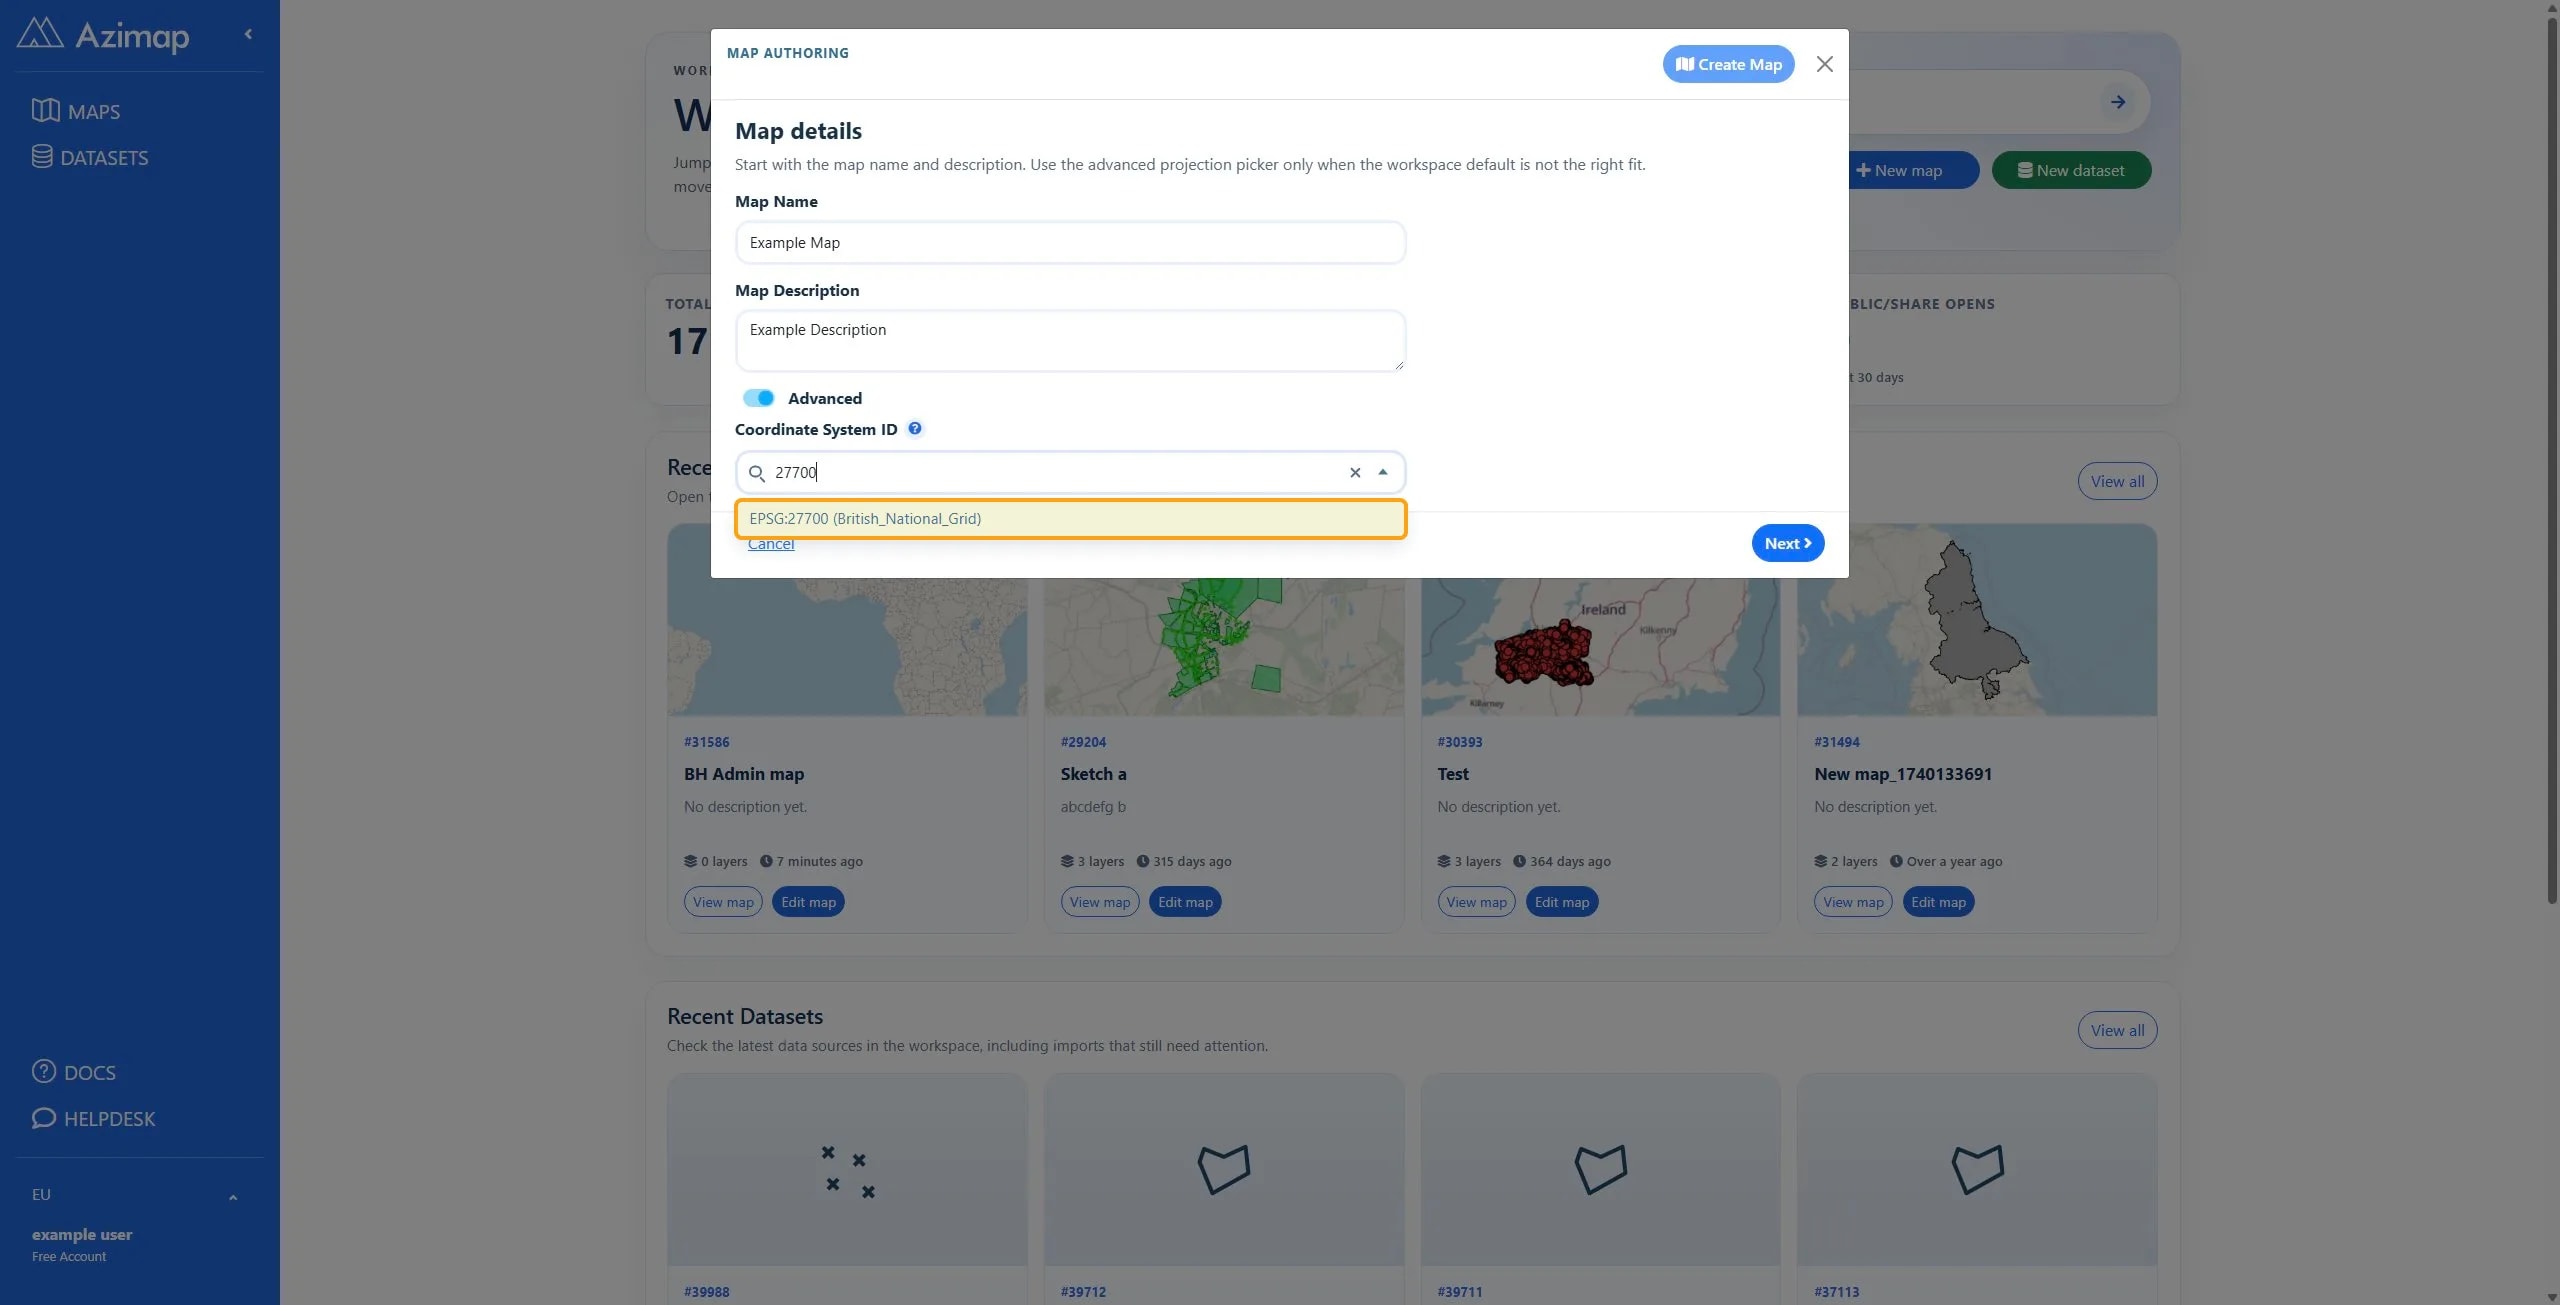
TipYou can search for a custom projection based on name or code.
5
Search for your desired projection e.g. EPSG:27700 (British_National_Grid).
6
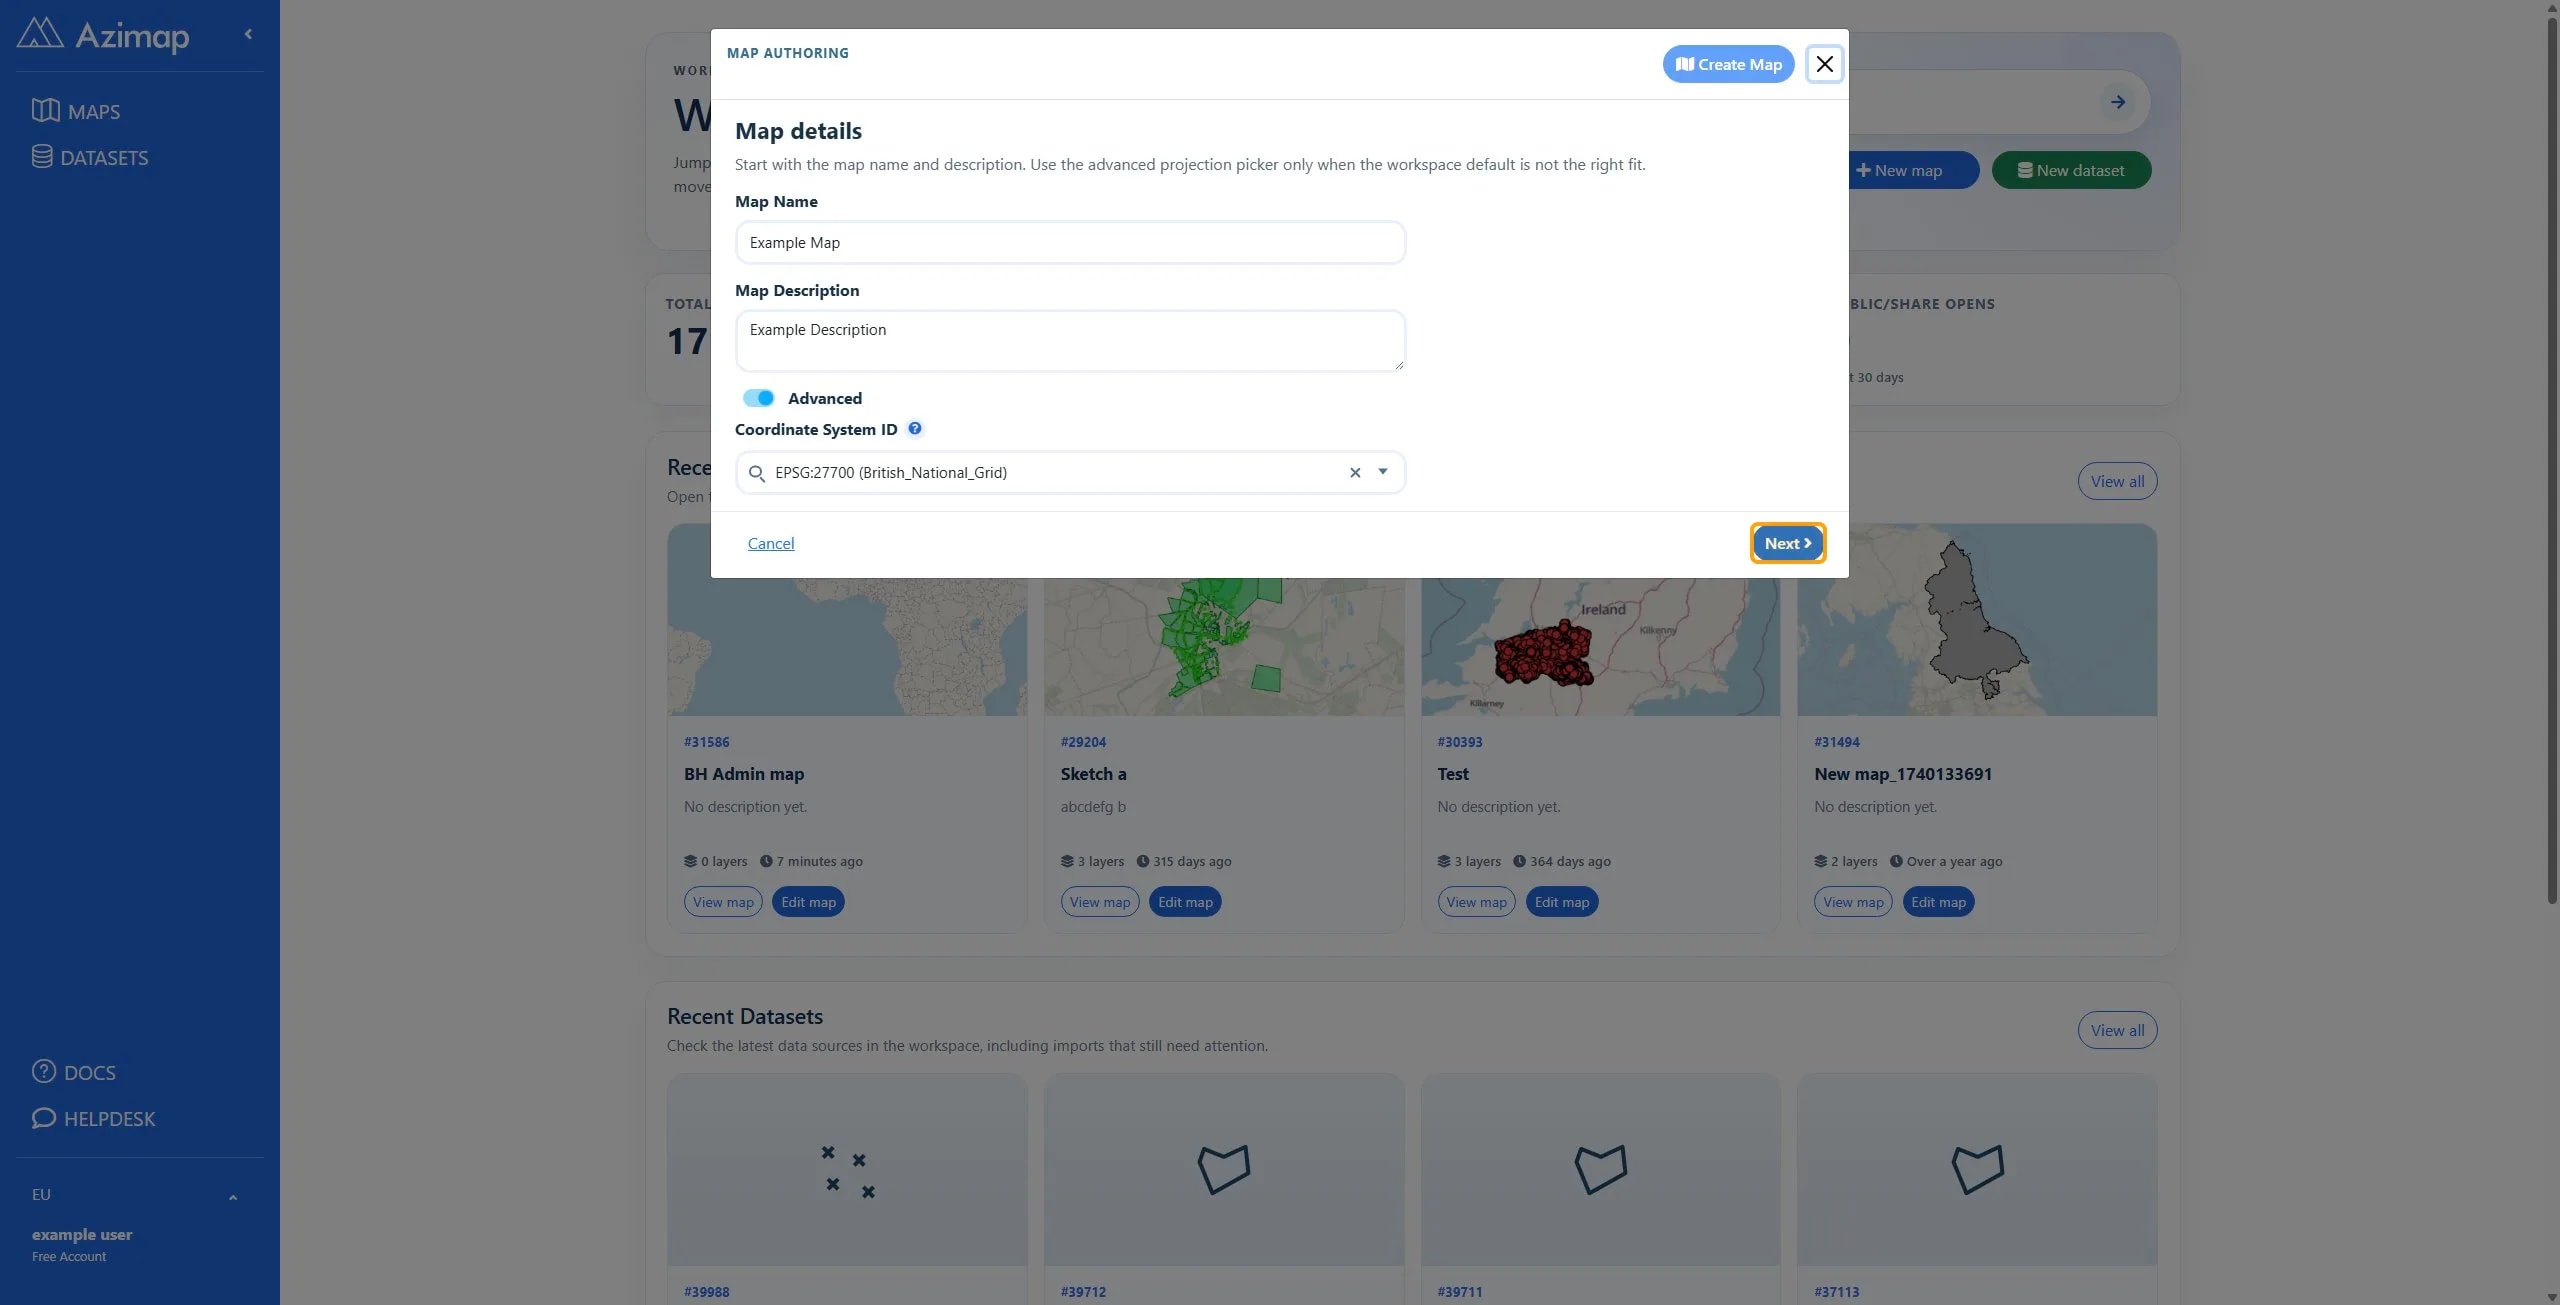
Click the Next button to proceed with map creation
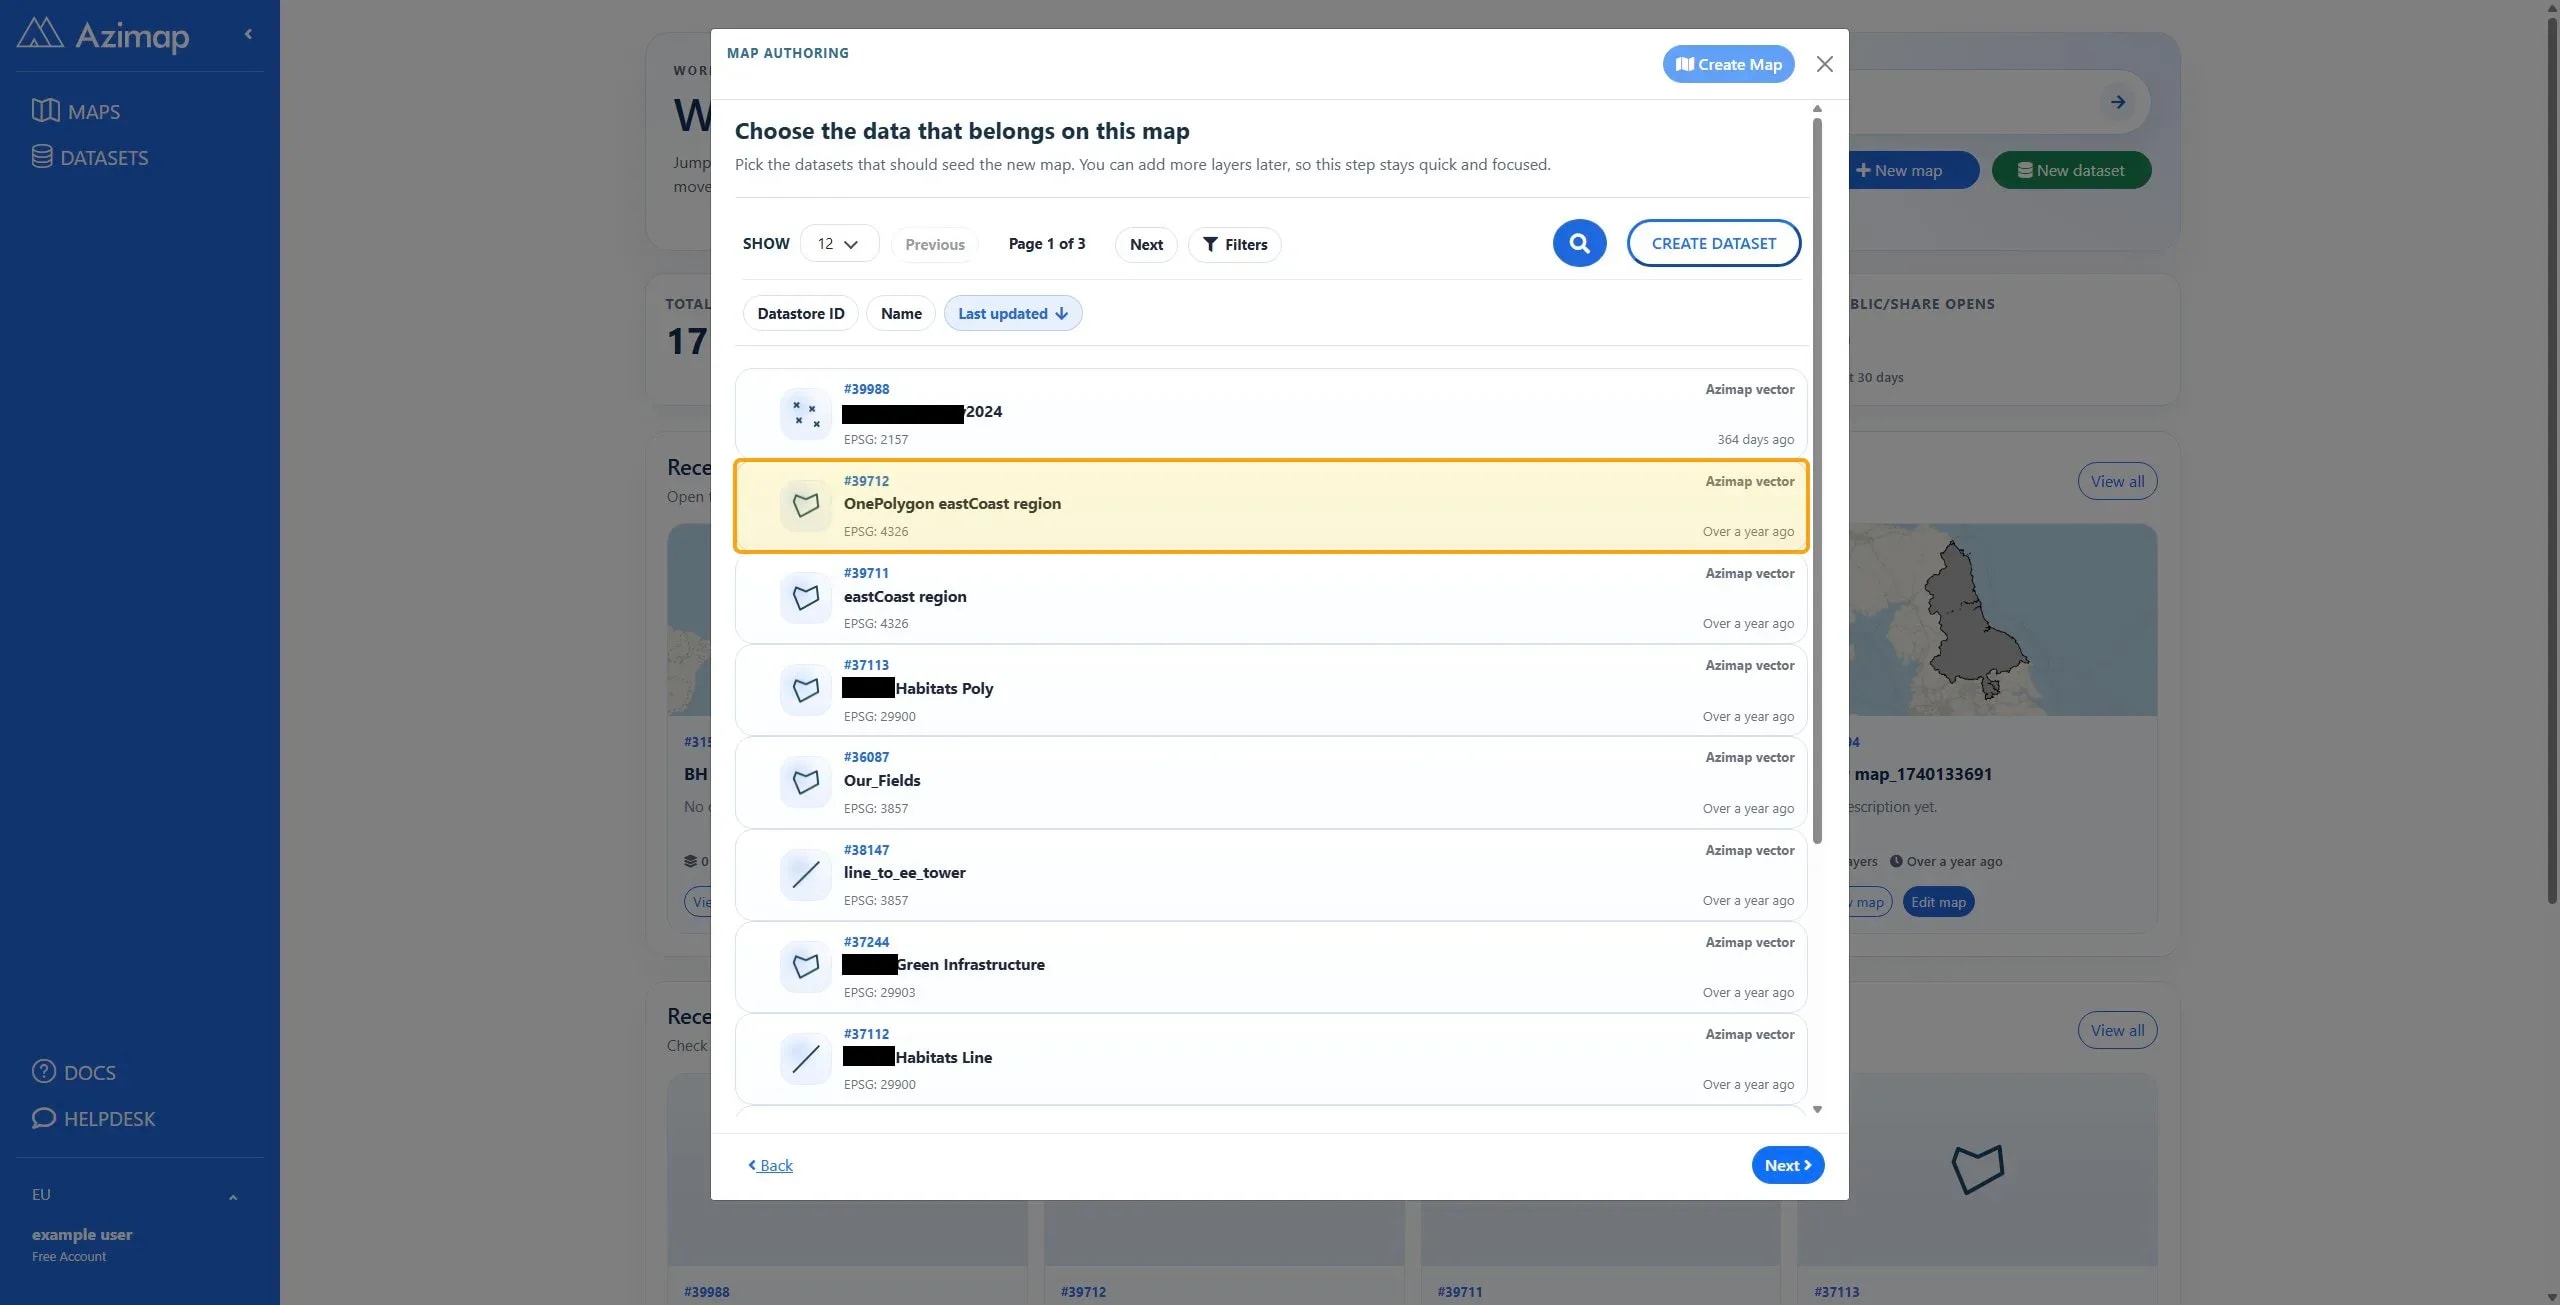
TipAt this point you can create a new dataset, search for existing datasets or click Next without any datasets selected to create an empty map.
7
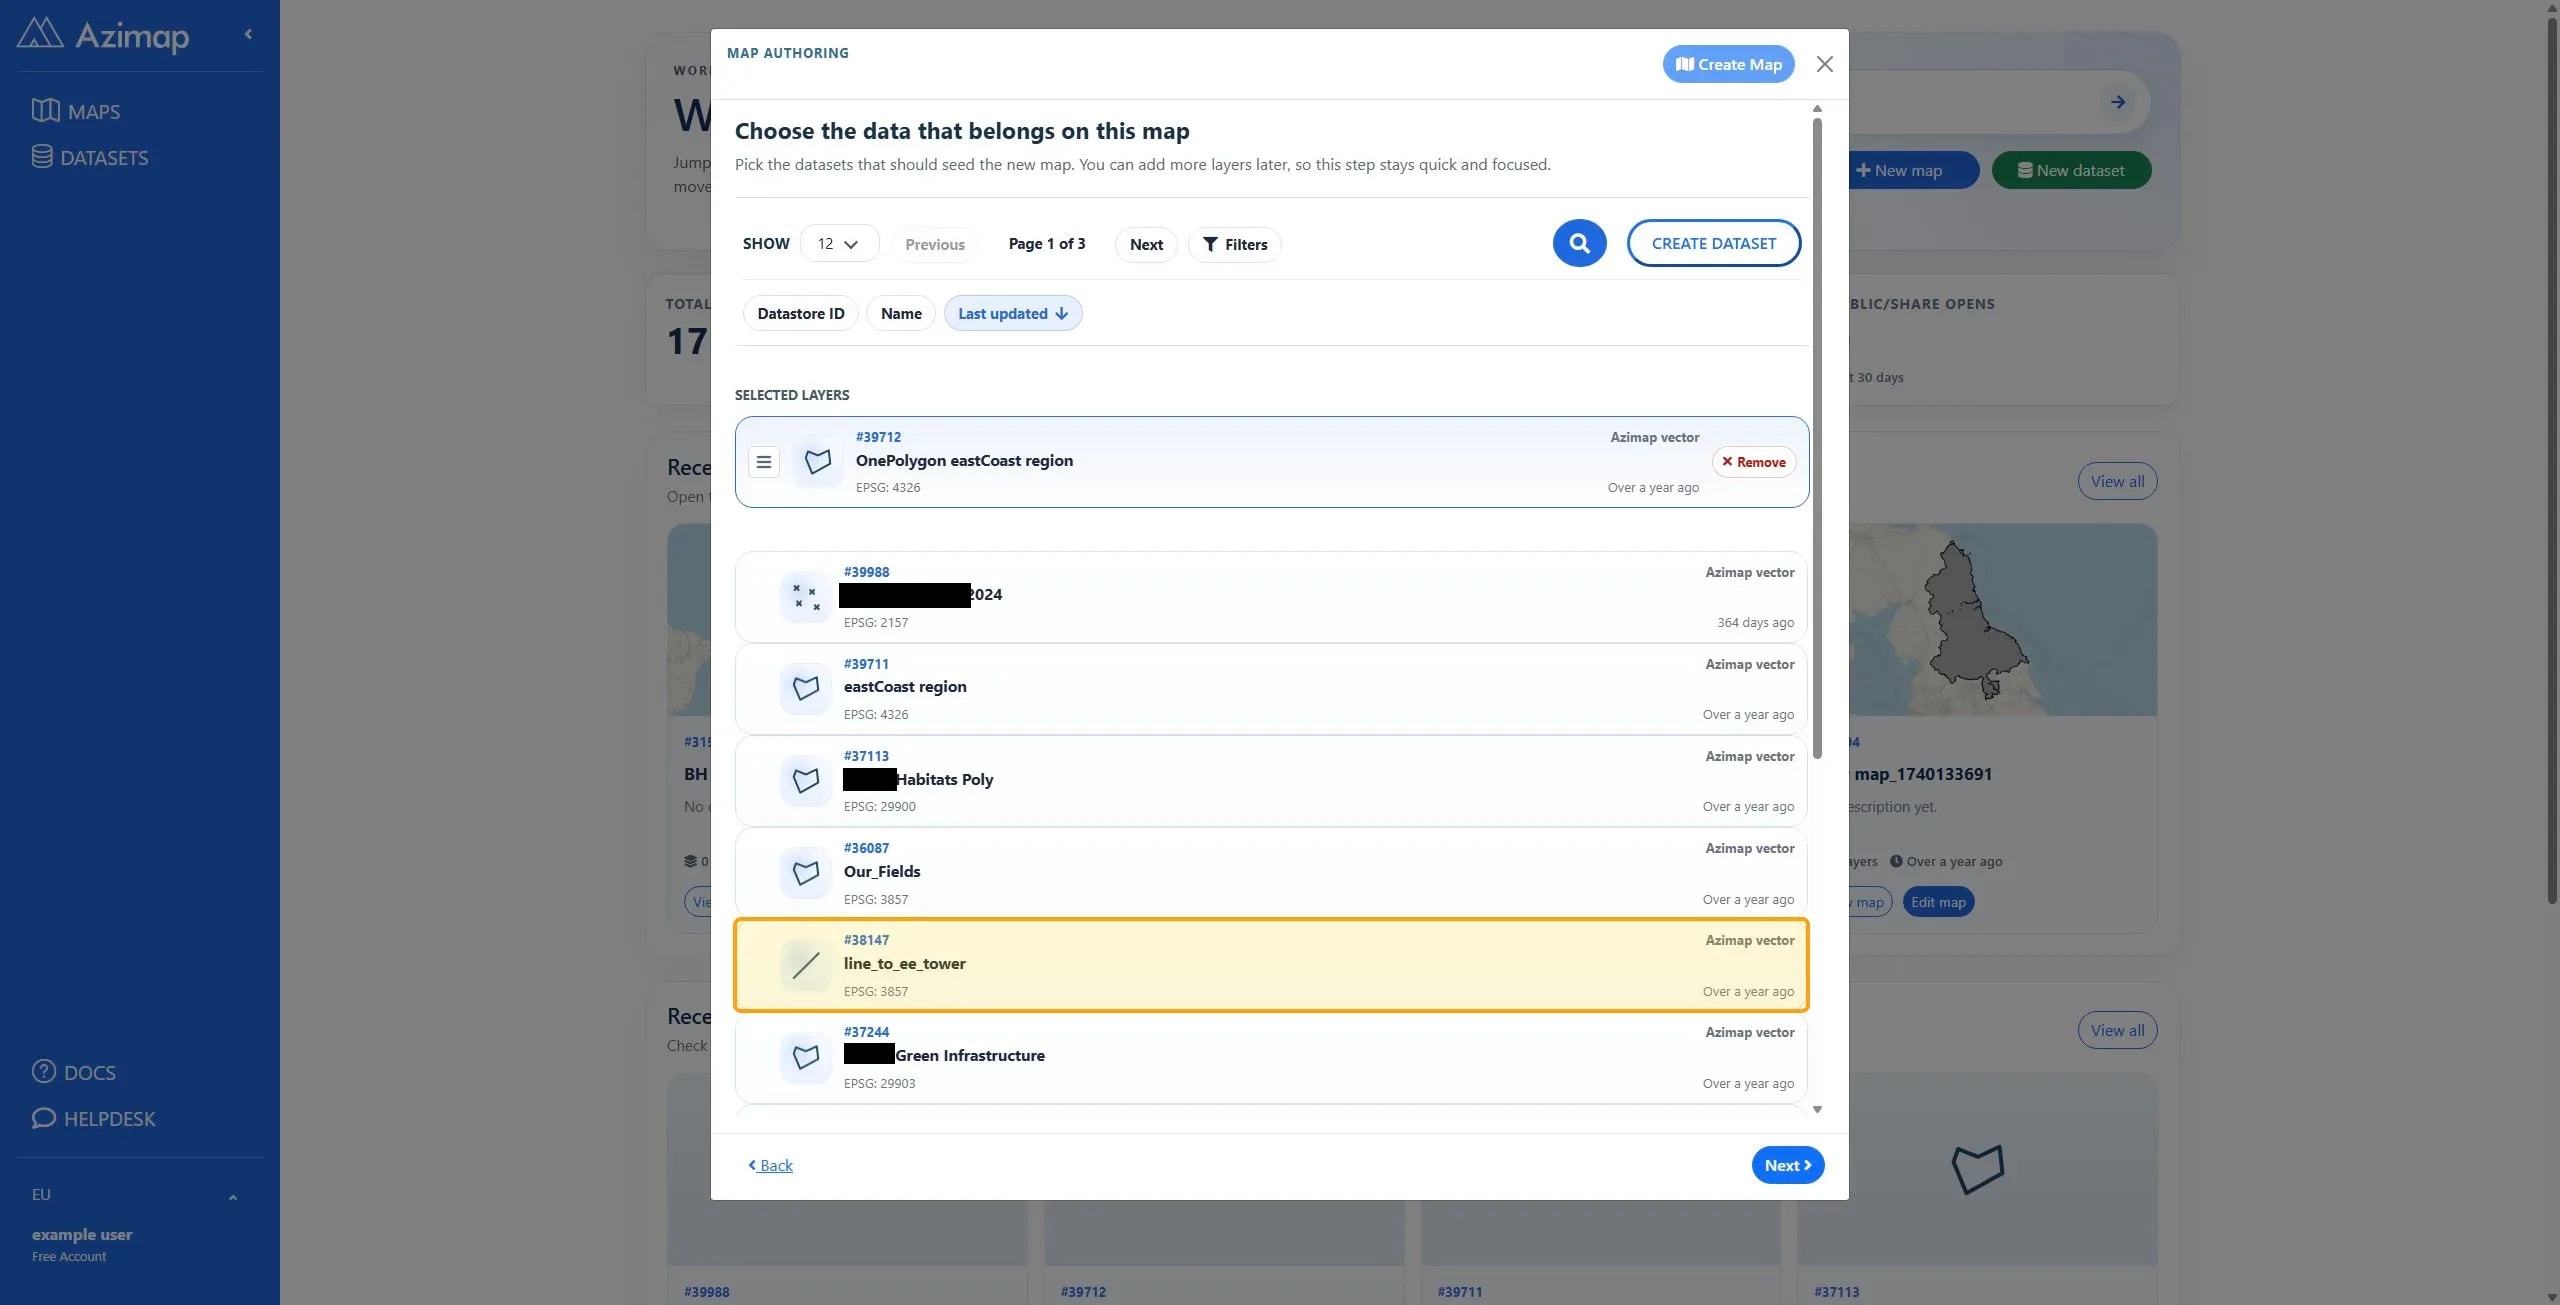
Select which datasets (if any) you wish to add to this map.
8
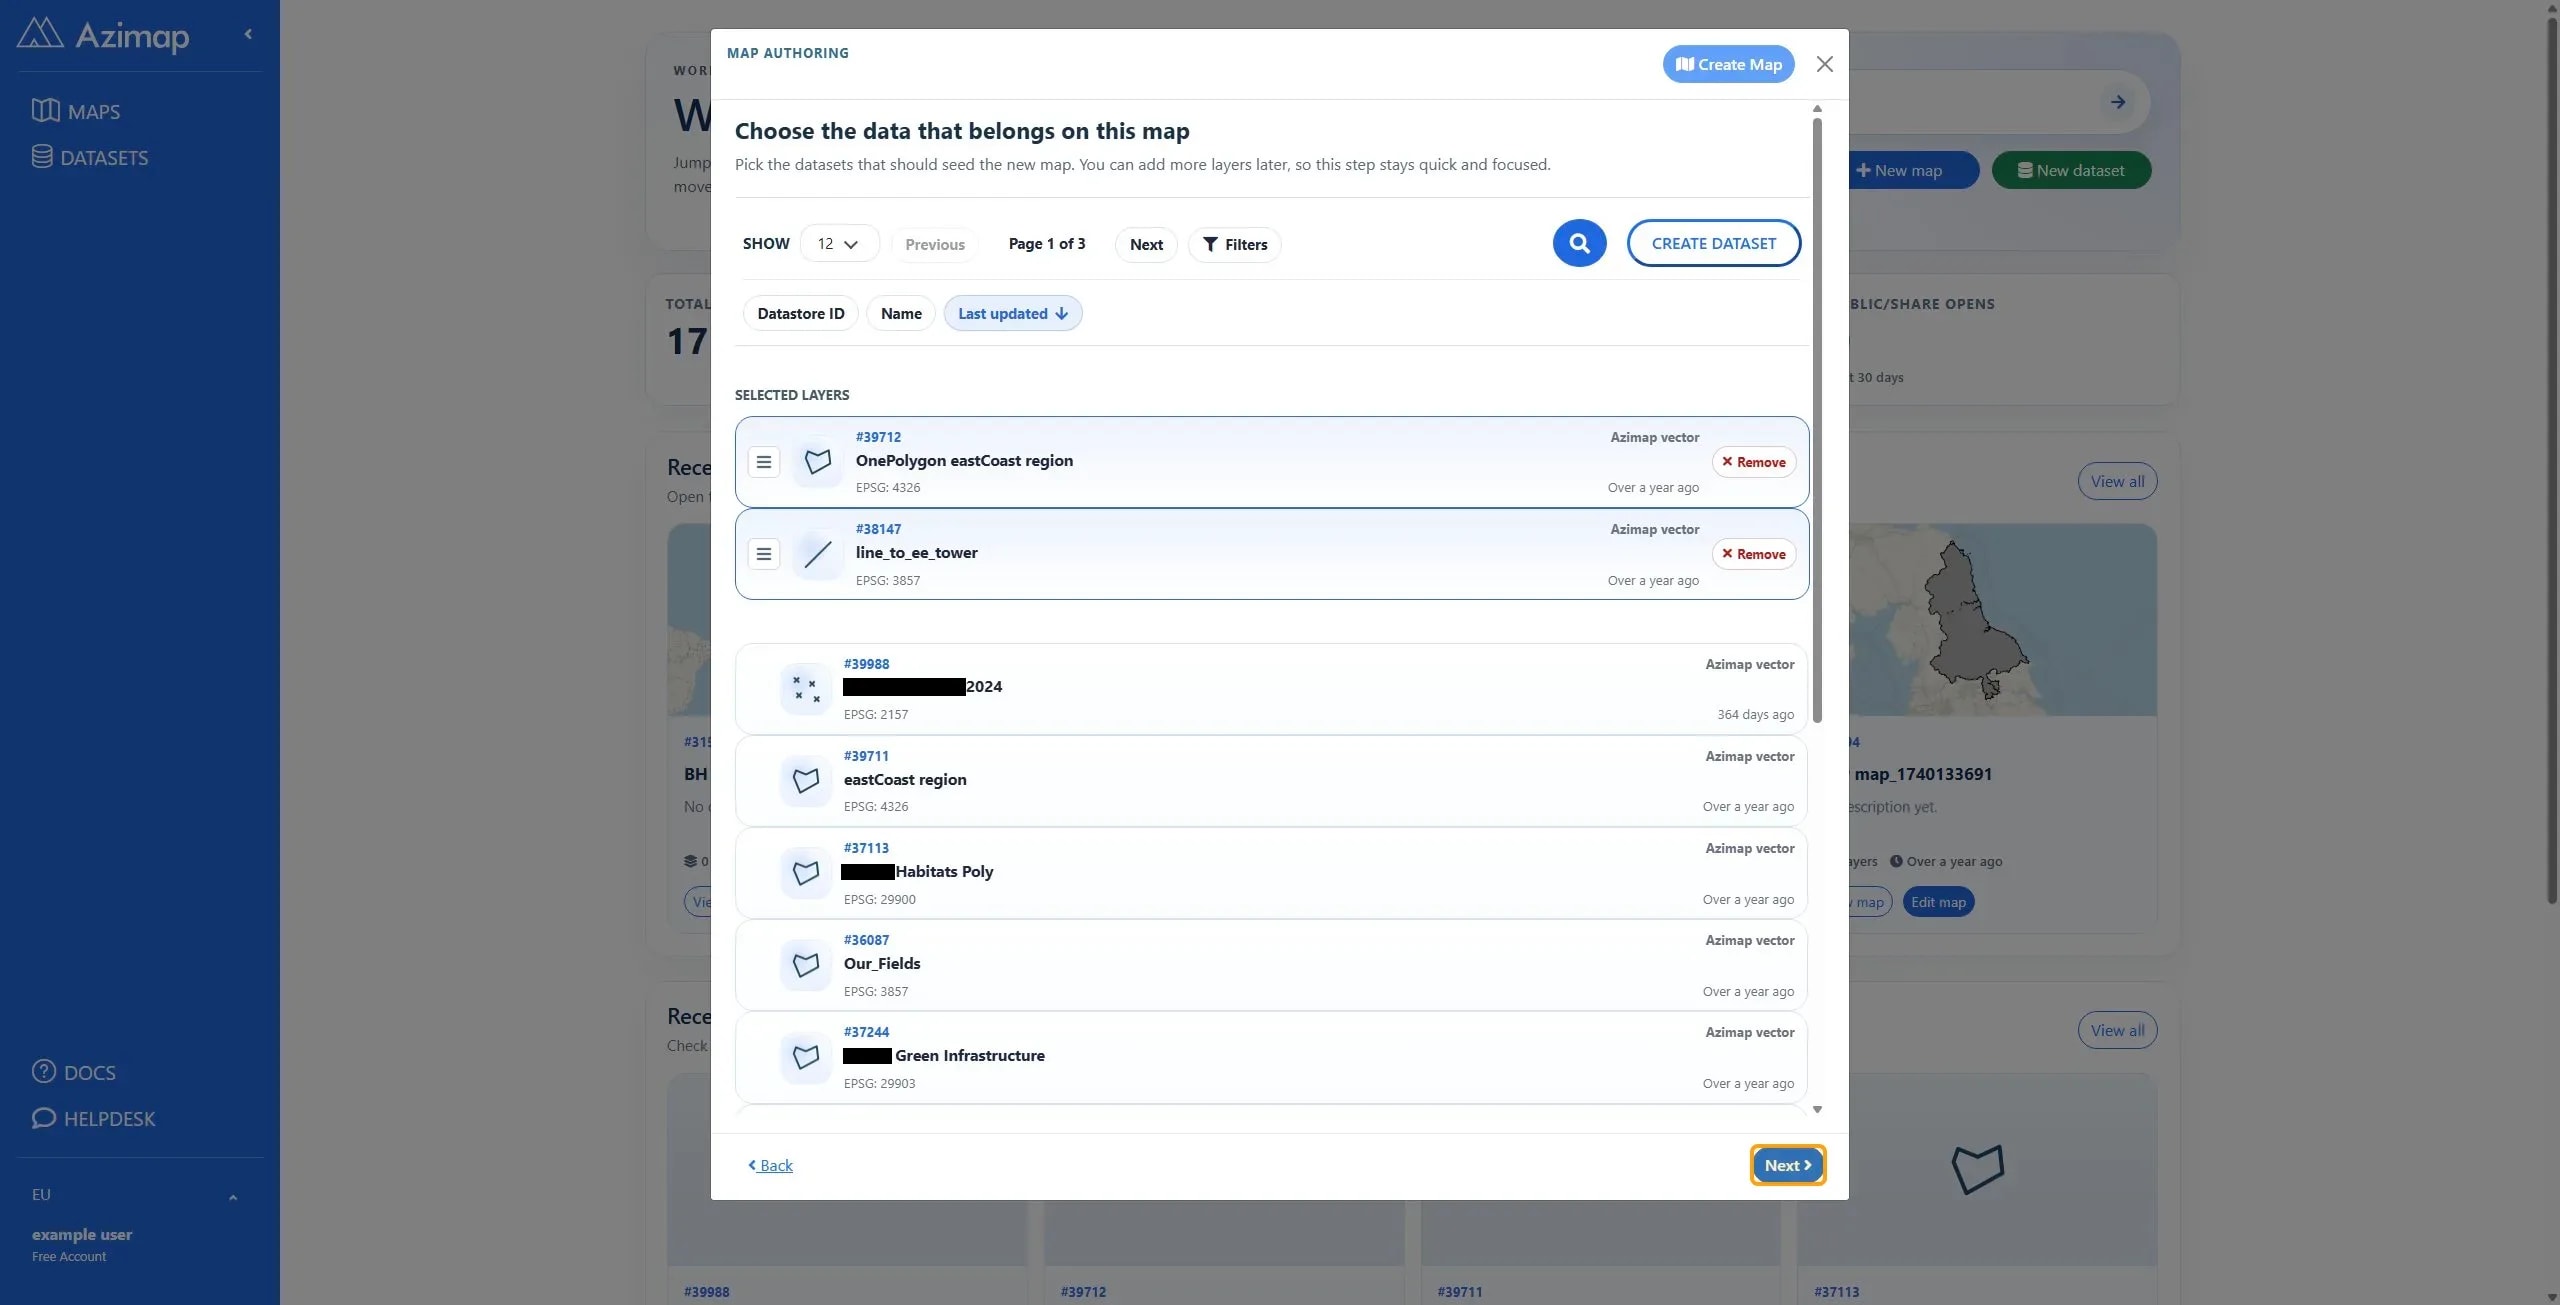
When selecting more than one dataset they can be reordered by using the icon on the left of the dataset.
9
Click the Next button to proceed with selecting map layers
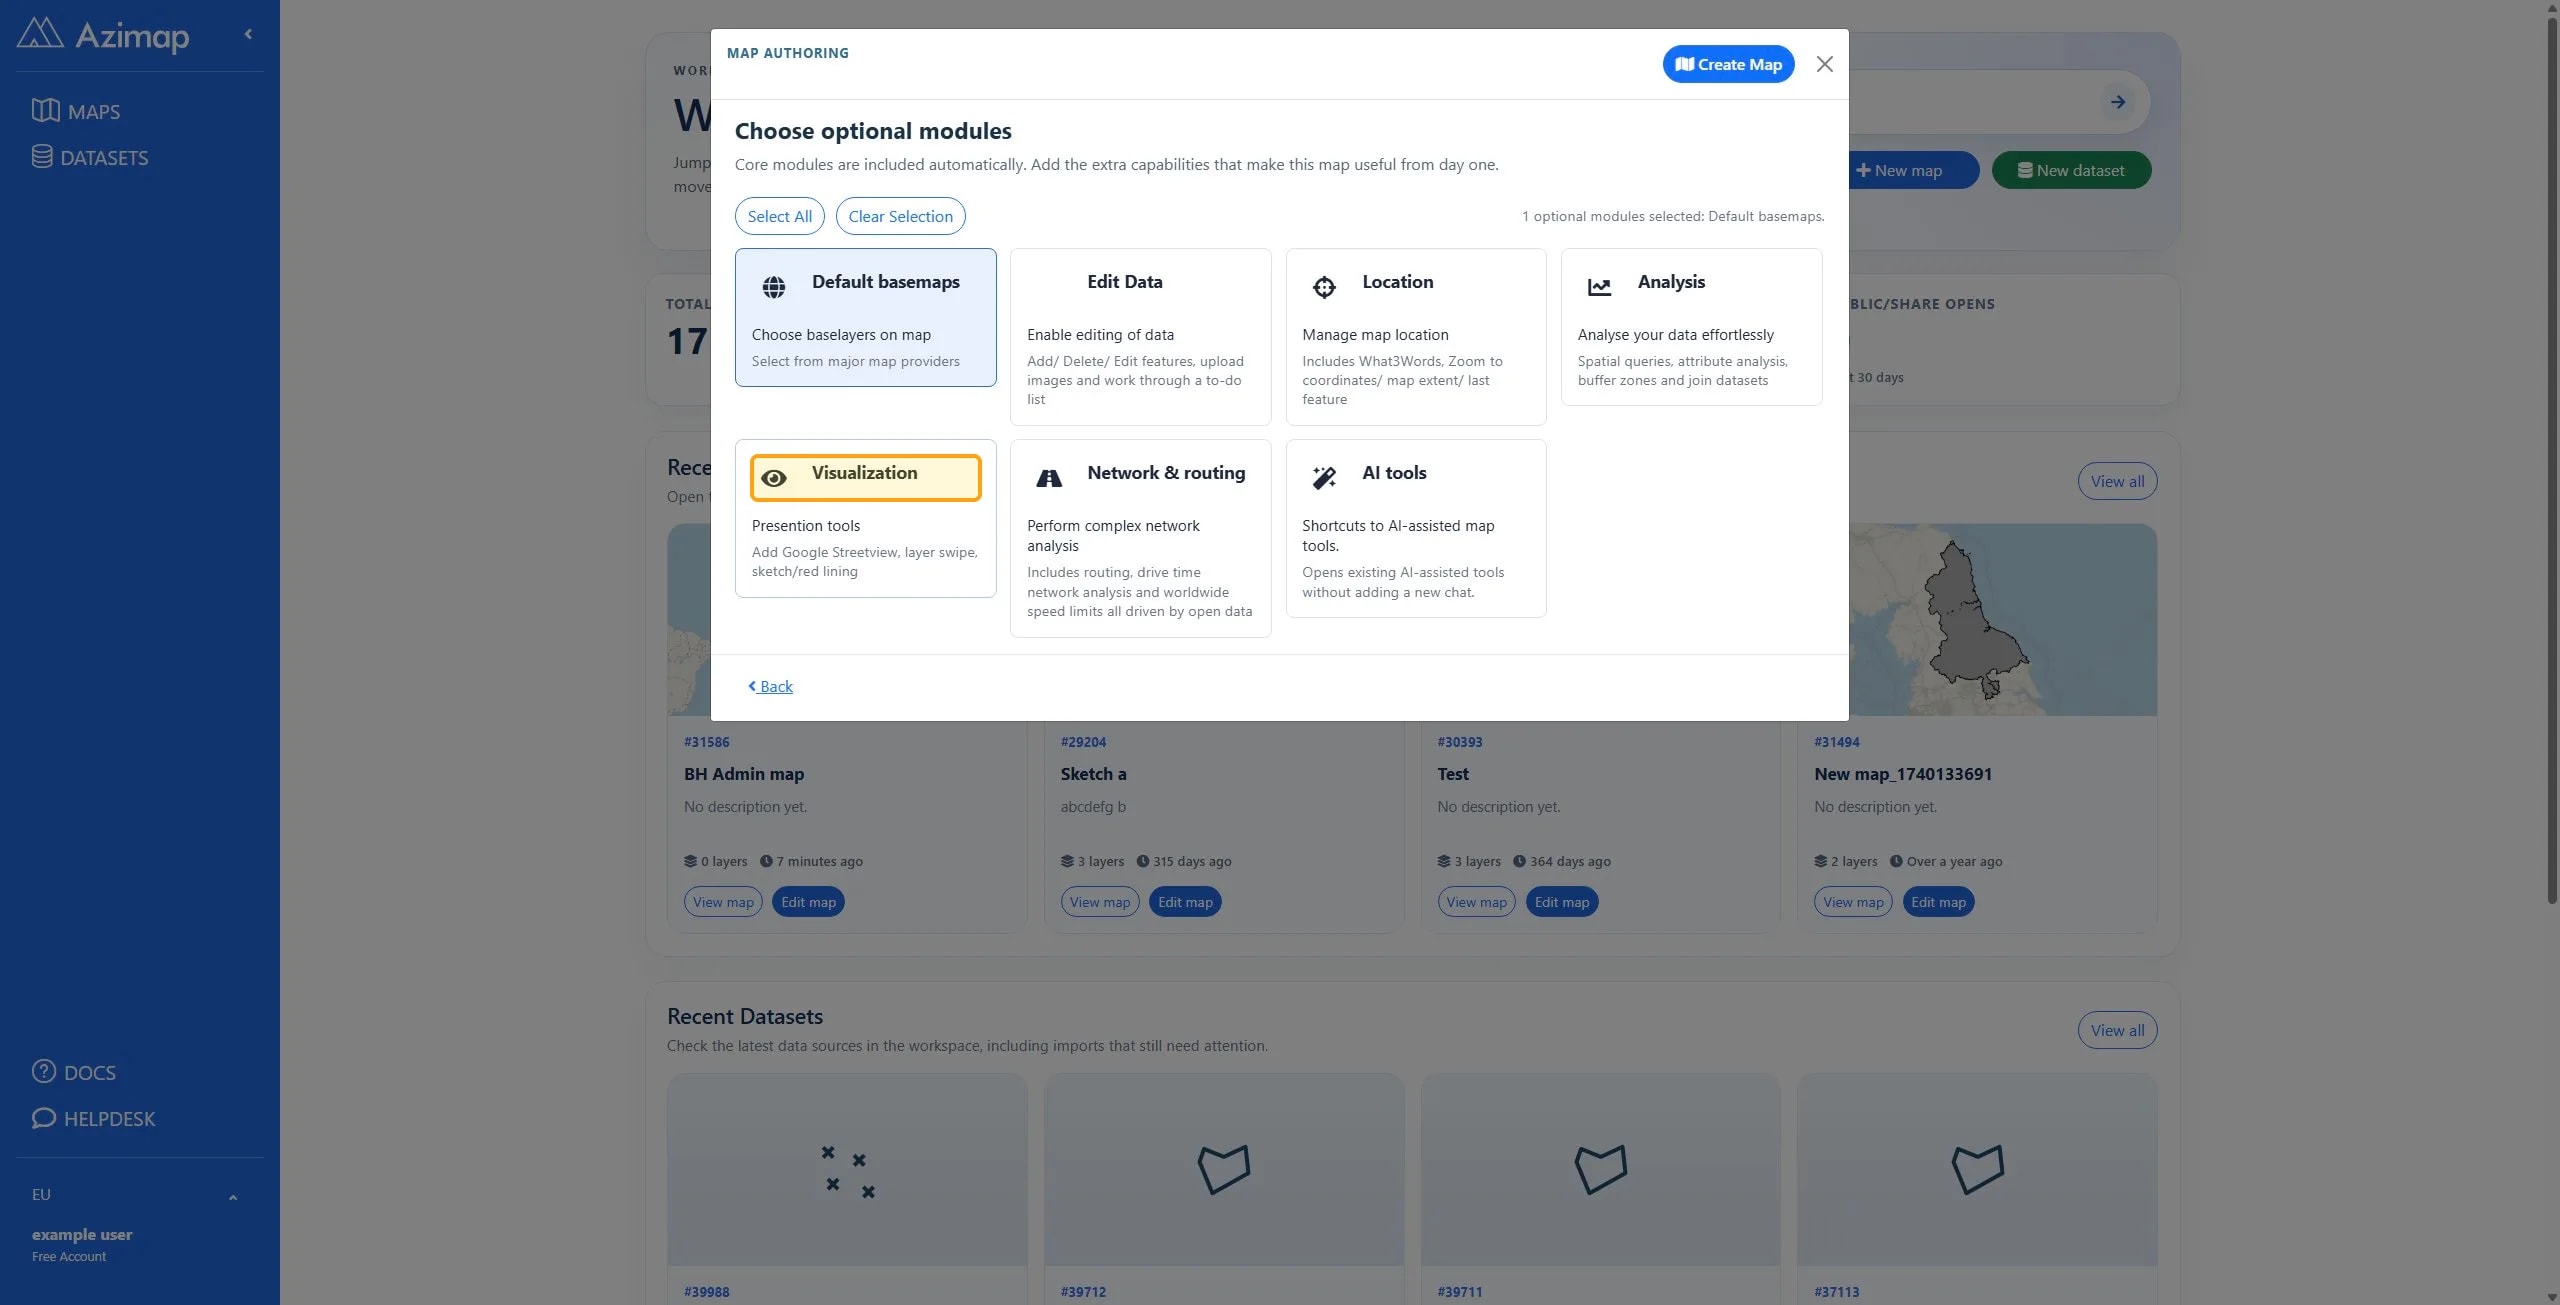
TipMap modules can be fine tuned later in the map configuration screen.
10
Select the module(s) you wish to apply to this map.
11
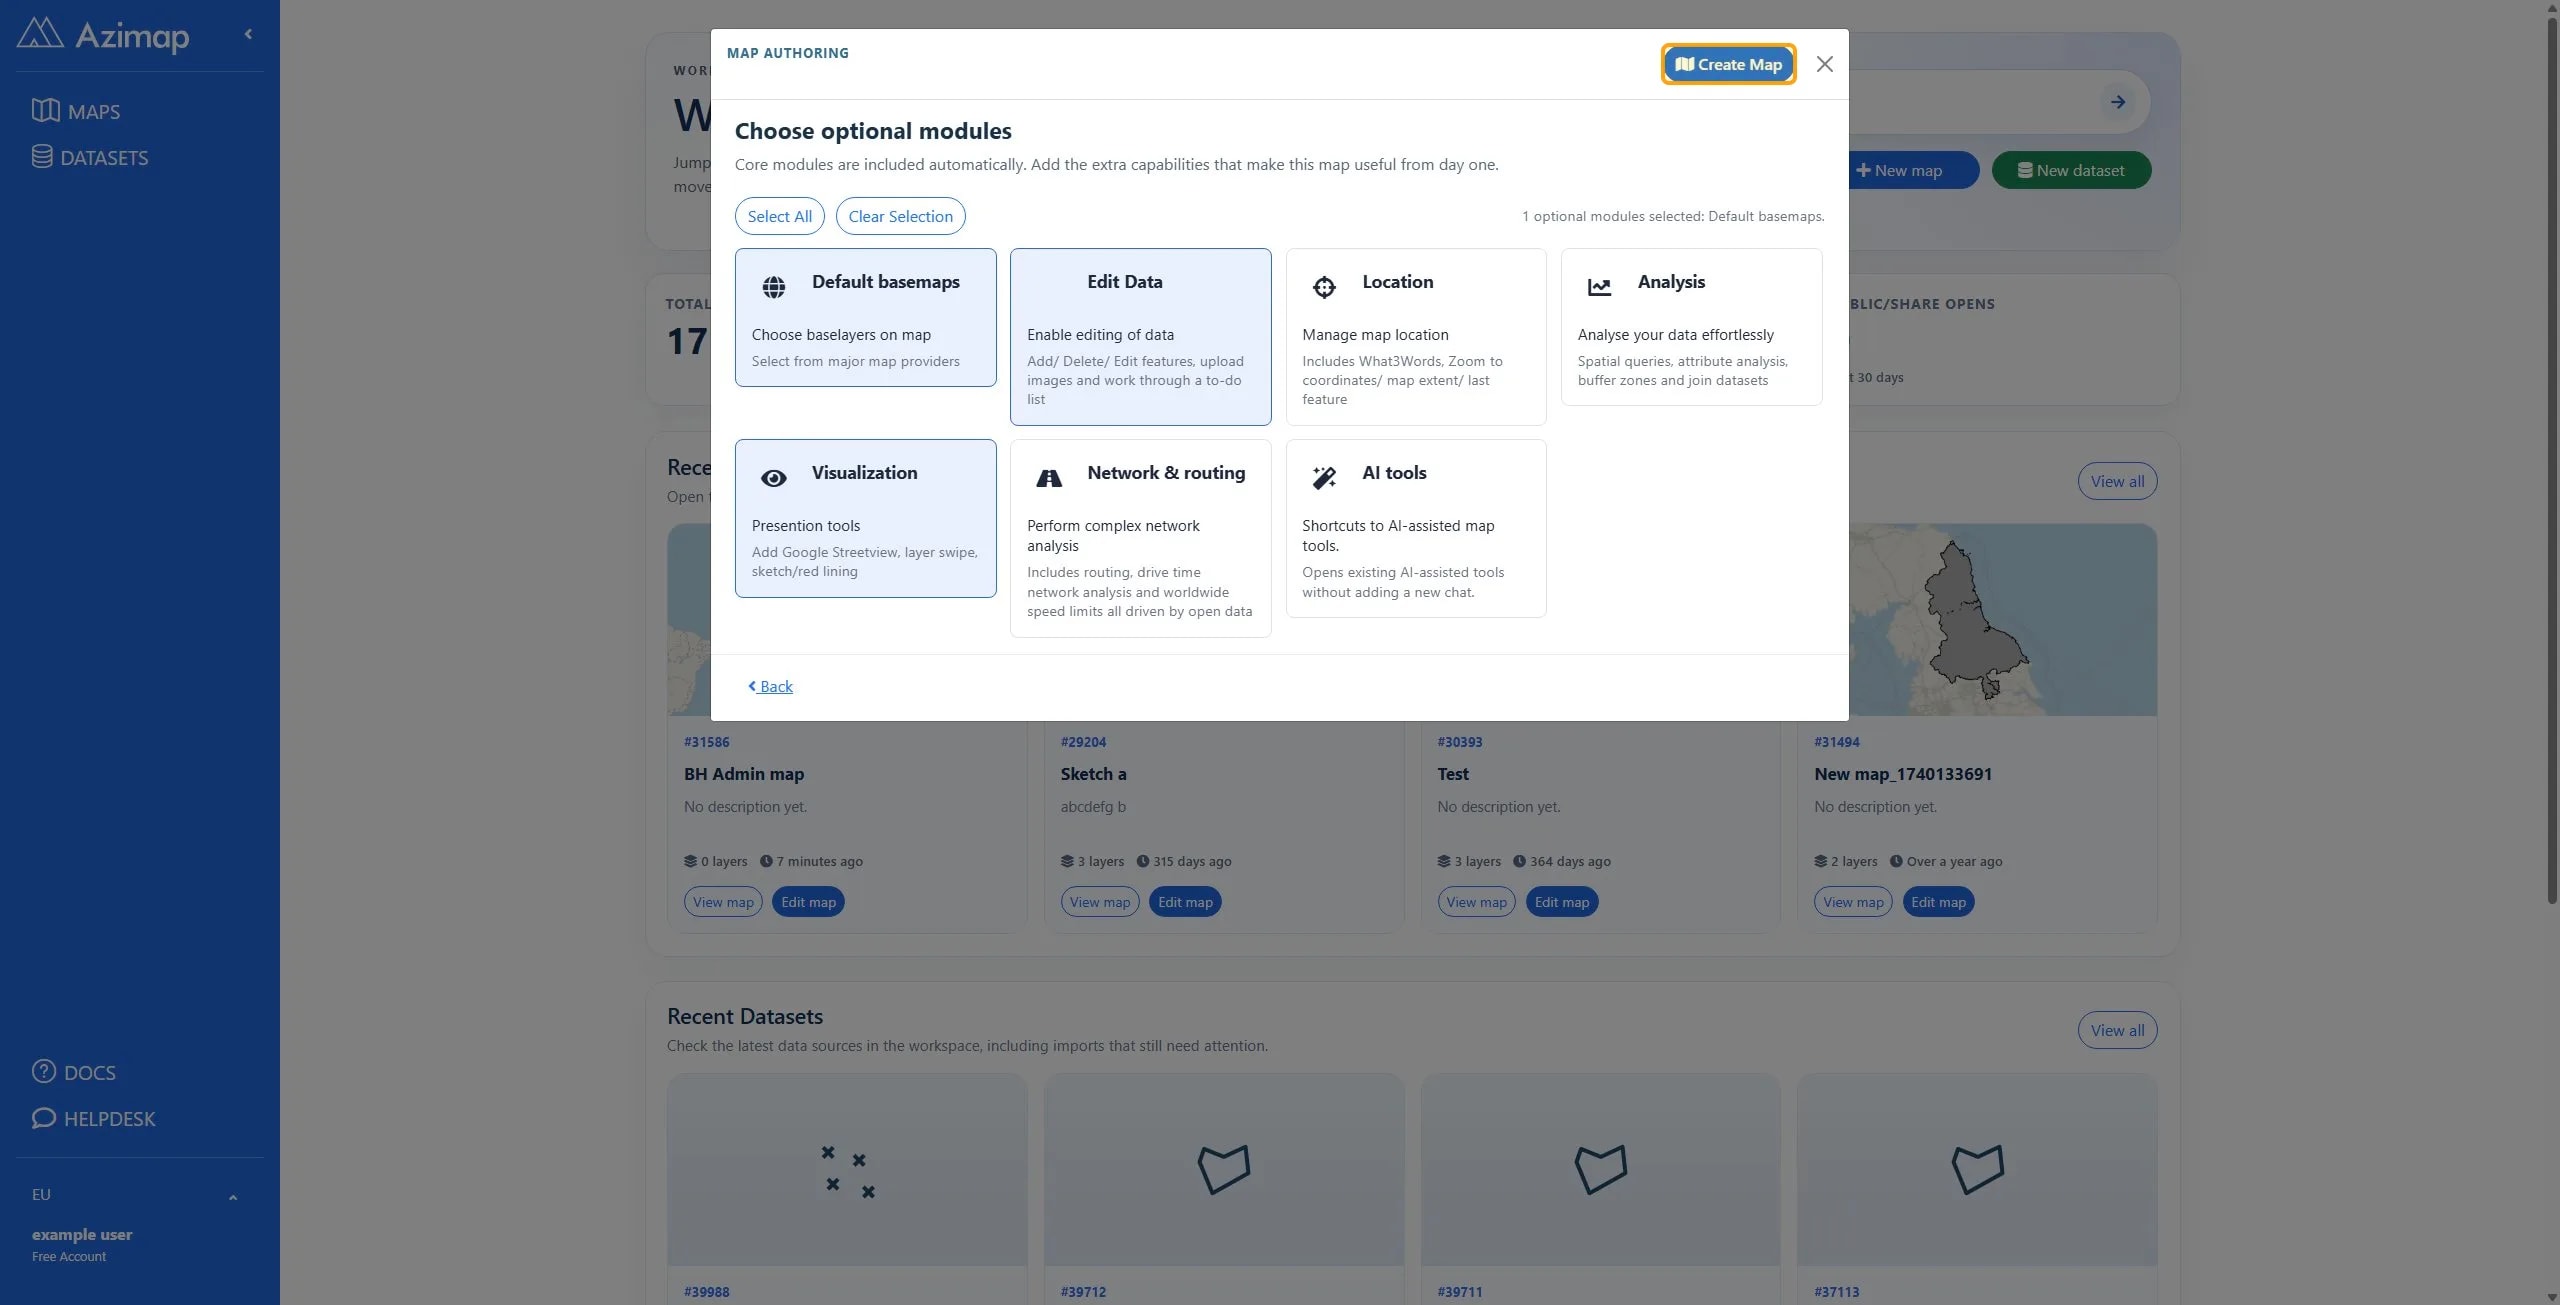
Click the Create Map button to proceed with map creation.
12
Your new map will now be opened on a new tab.