Azimap’s Latest Release — Feature Tour
New functionality
Completely rewritten map surface using OpenLayers 10+
Azimap’s map canvas has been rebuilt on OpenLayers 10+, delivering smoother rendering, better label collision, and GPU-accelerated panning/zooming—especially with large datasets.
Application is now API-driven with all actions performed through API
Every operation—editing, analysis, printing, exporting—now flows through a secured Web API, giving consistent behavior, auditability, and easier automation.
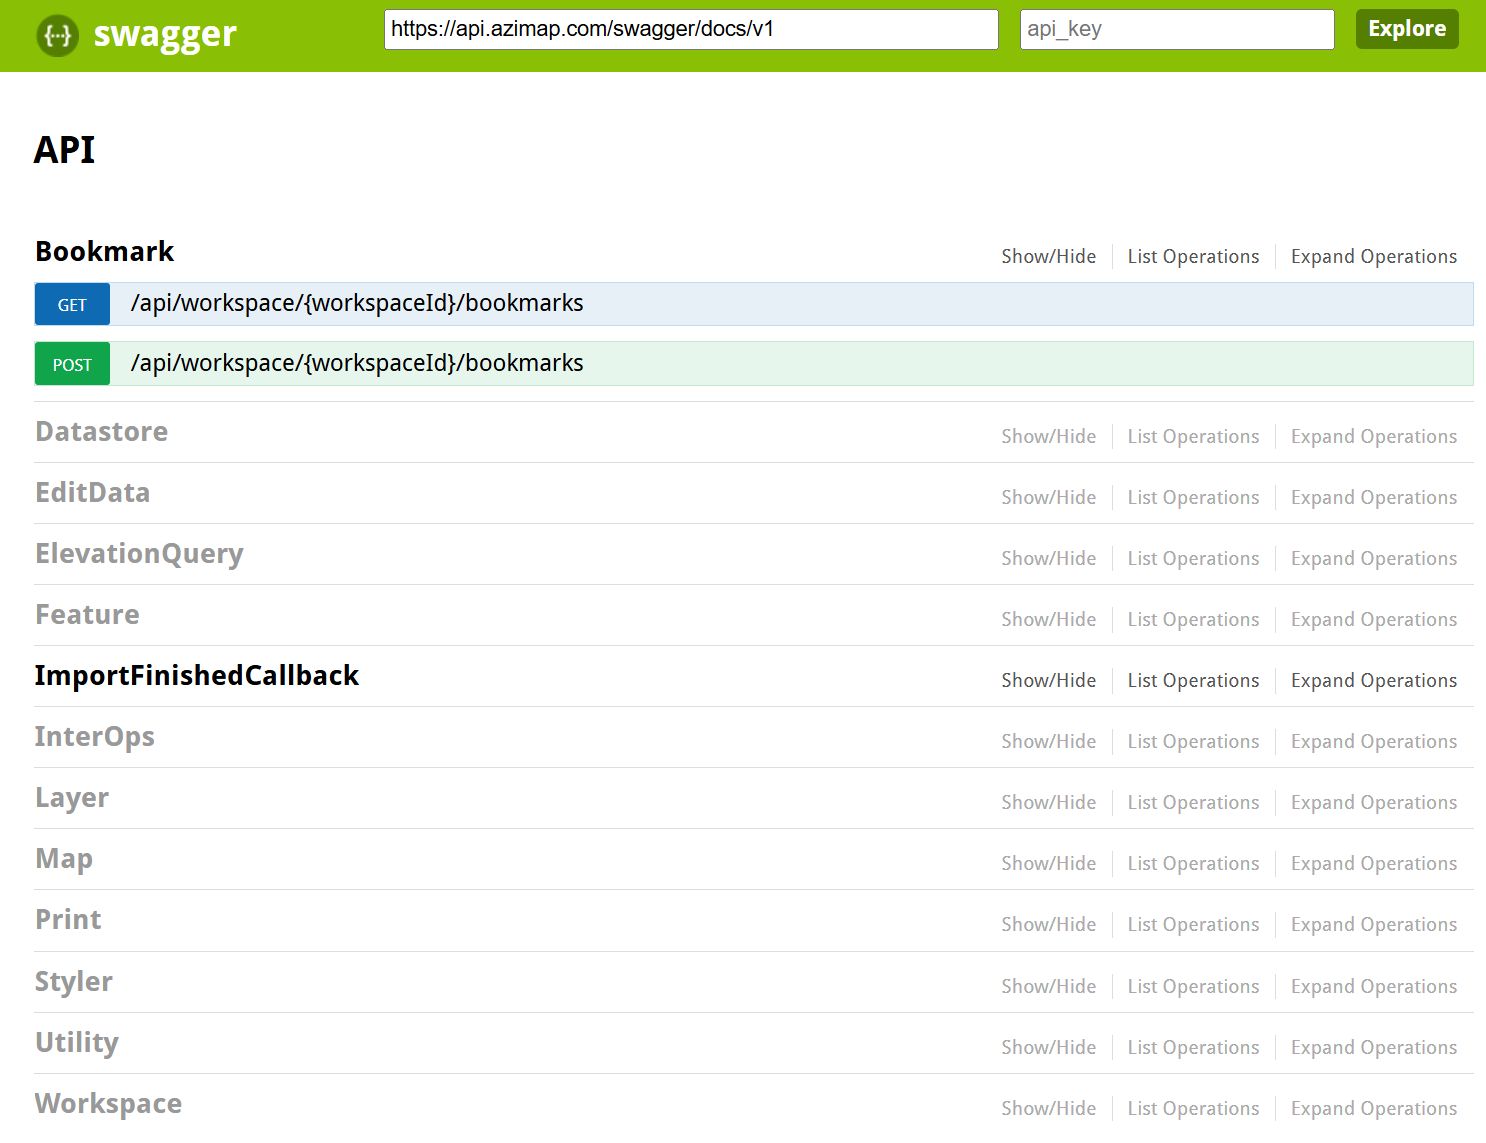
New Development API (OpenAPI/Swagger)
Developers can explore endpoints, try requests, and generate client SDKs via OpenAPI/Swagger—speeding up integrations with your .NET Web API and third-party systems.
All tools and map functions rewritten to be efficient and performant
We re-engineered the toolchain to minimize redraws, reduce DOM churn, and keep interactions snappy—even on complex layers.
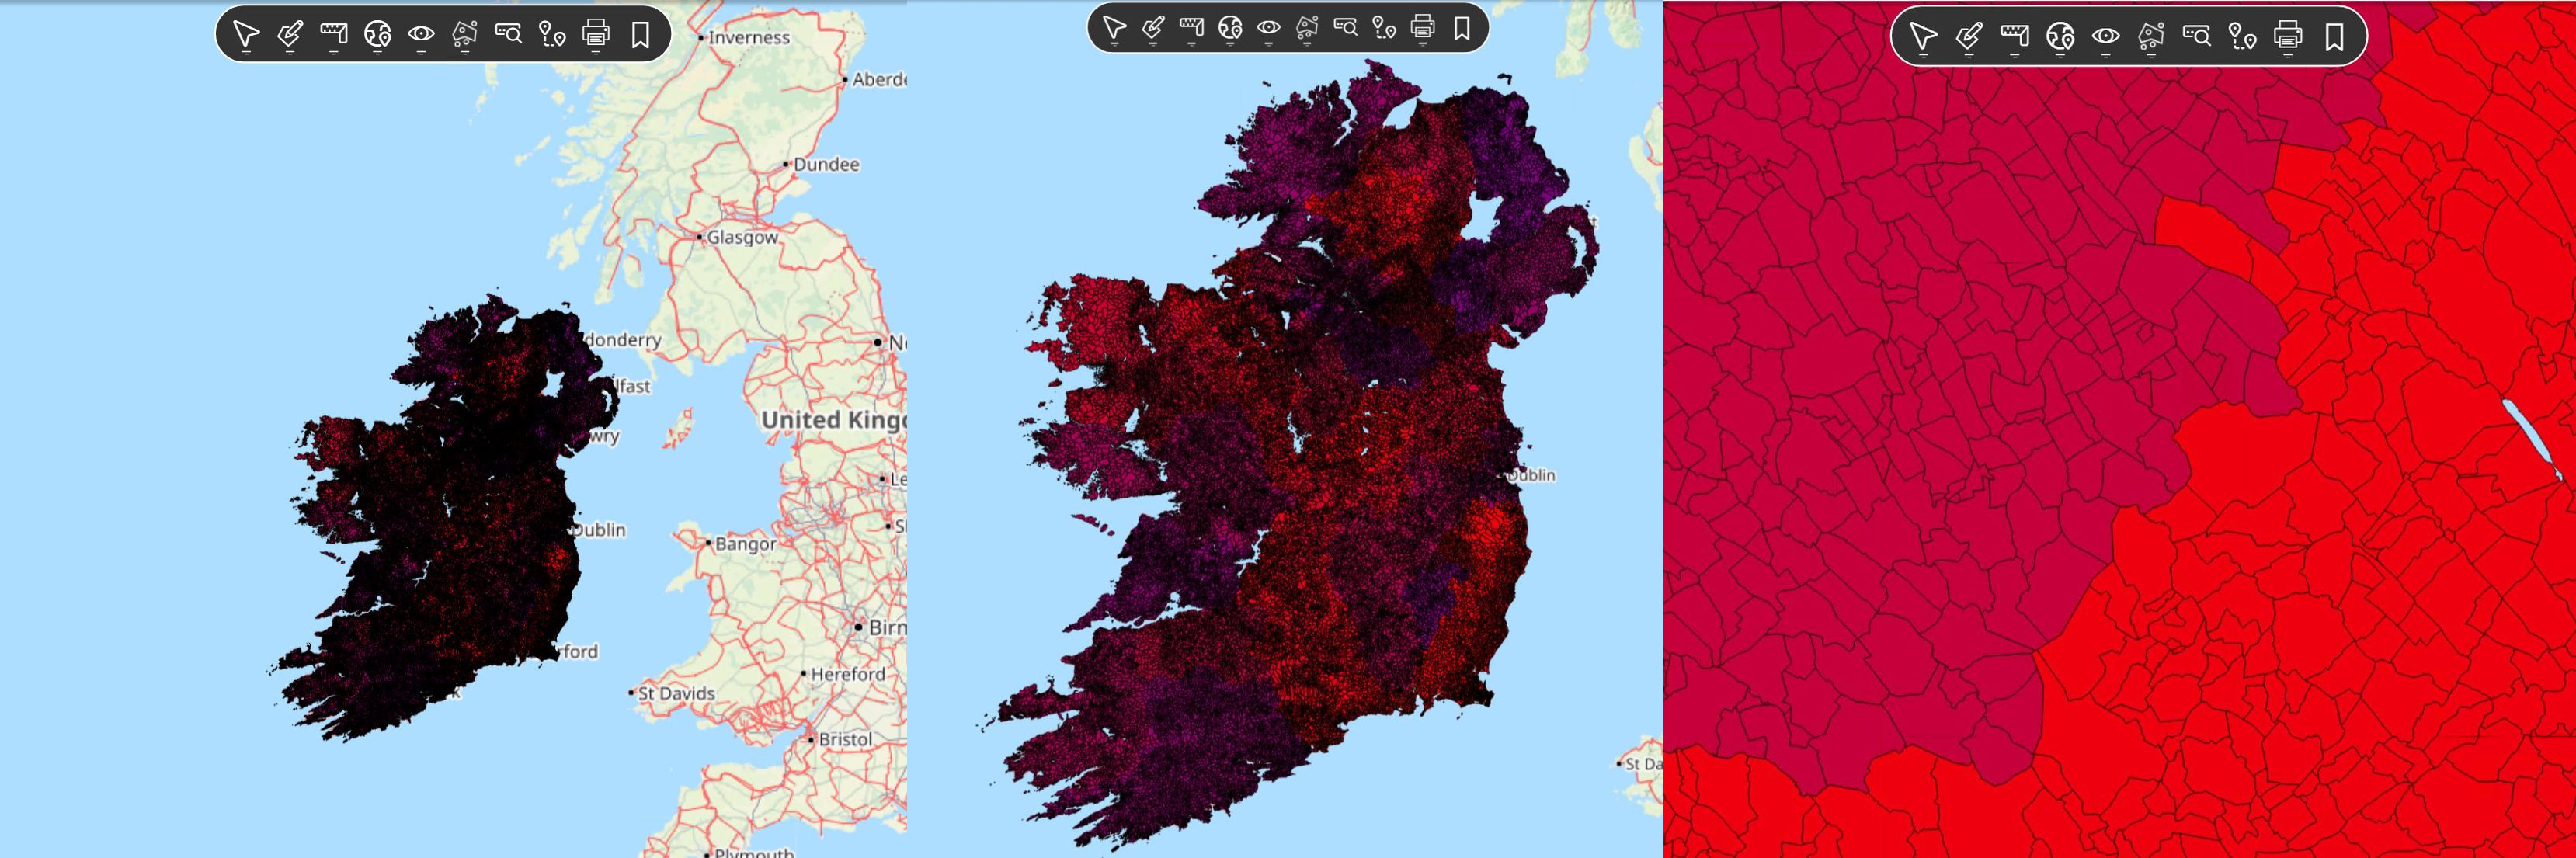
Vector tiles by default — with all the benefits that brings
Vector tiles are now the default. Azimap streams geometry + attributes and renders styles on the client:
- Crisp at any zoom: Labels/lines stay sharp on Retina/4K; no raster blur.
- Smaller payloads: Only requested tiles are fetched; style changes don’t require republishing.
- Dynamic cartography: Change colors, widths, icons, and label rules live.
- Feature interactivity: Hover, click, filter, highlight, and popup directly from attributes.
- Scale-aware styling: Rules per zoom reveal detail progressively.
- Faster updates: Data refreshes without tile rebuilds.
- Better labeling: Client-side decluttering and collision handling.
- GPU acceleration & offline-friendly options (where enabled).
Other supported types include
- Vector WMS: WMS-style convenience with client-side vector rendering + interactivity.
- WMS single tile: One image per view—great for print views and avoiding tile seams on complex server styles.
- VectorImage: Client rasterization of vectors into a single image layer to smooth performance with very dense data.
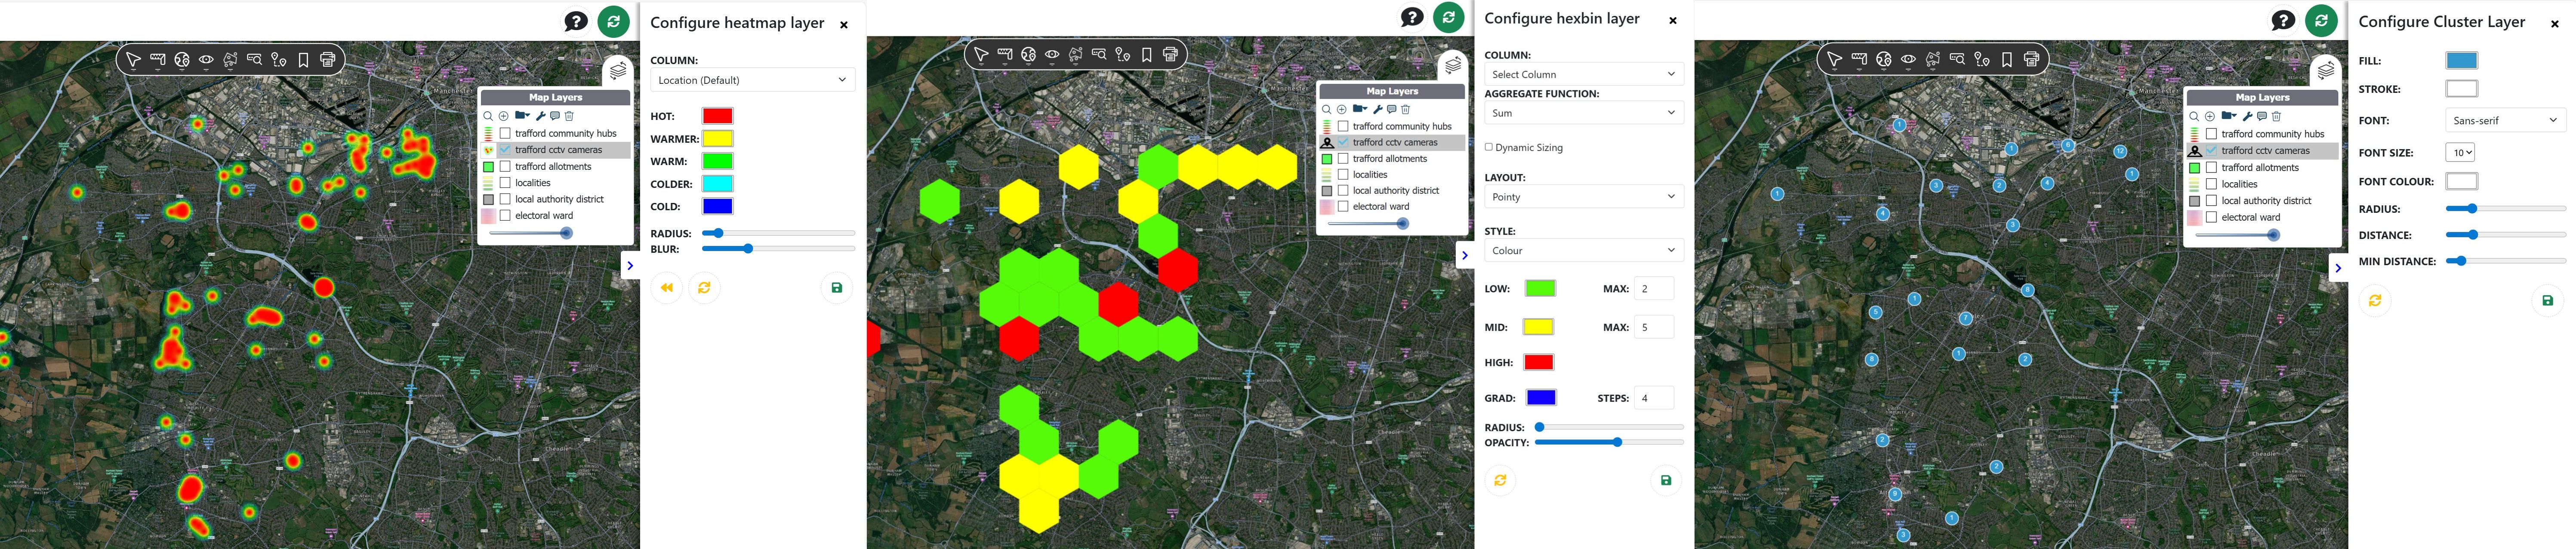
- Heatmap: Point intensity visualization (tunable radius/blur/weights) for hotspots.
- Hexbin: Aggregates points into hexagons for clean density/distribution mapping.
- Cluster: Groups nearby points into symbols with counts; splits as you zoom.
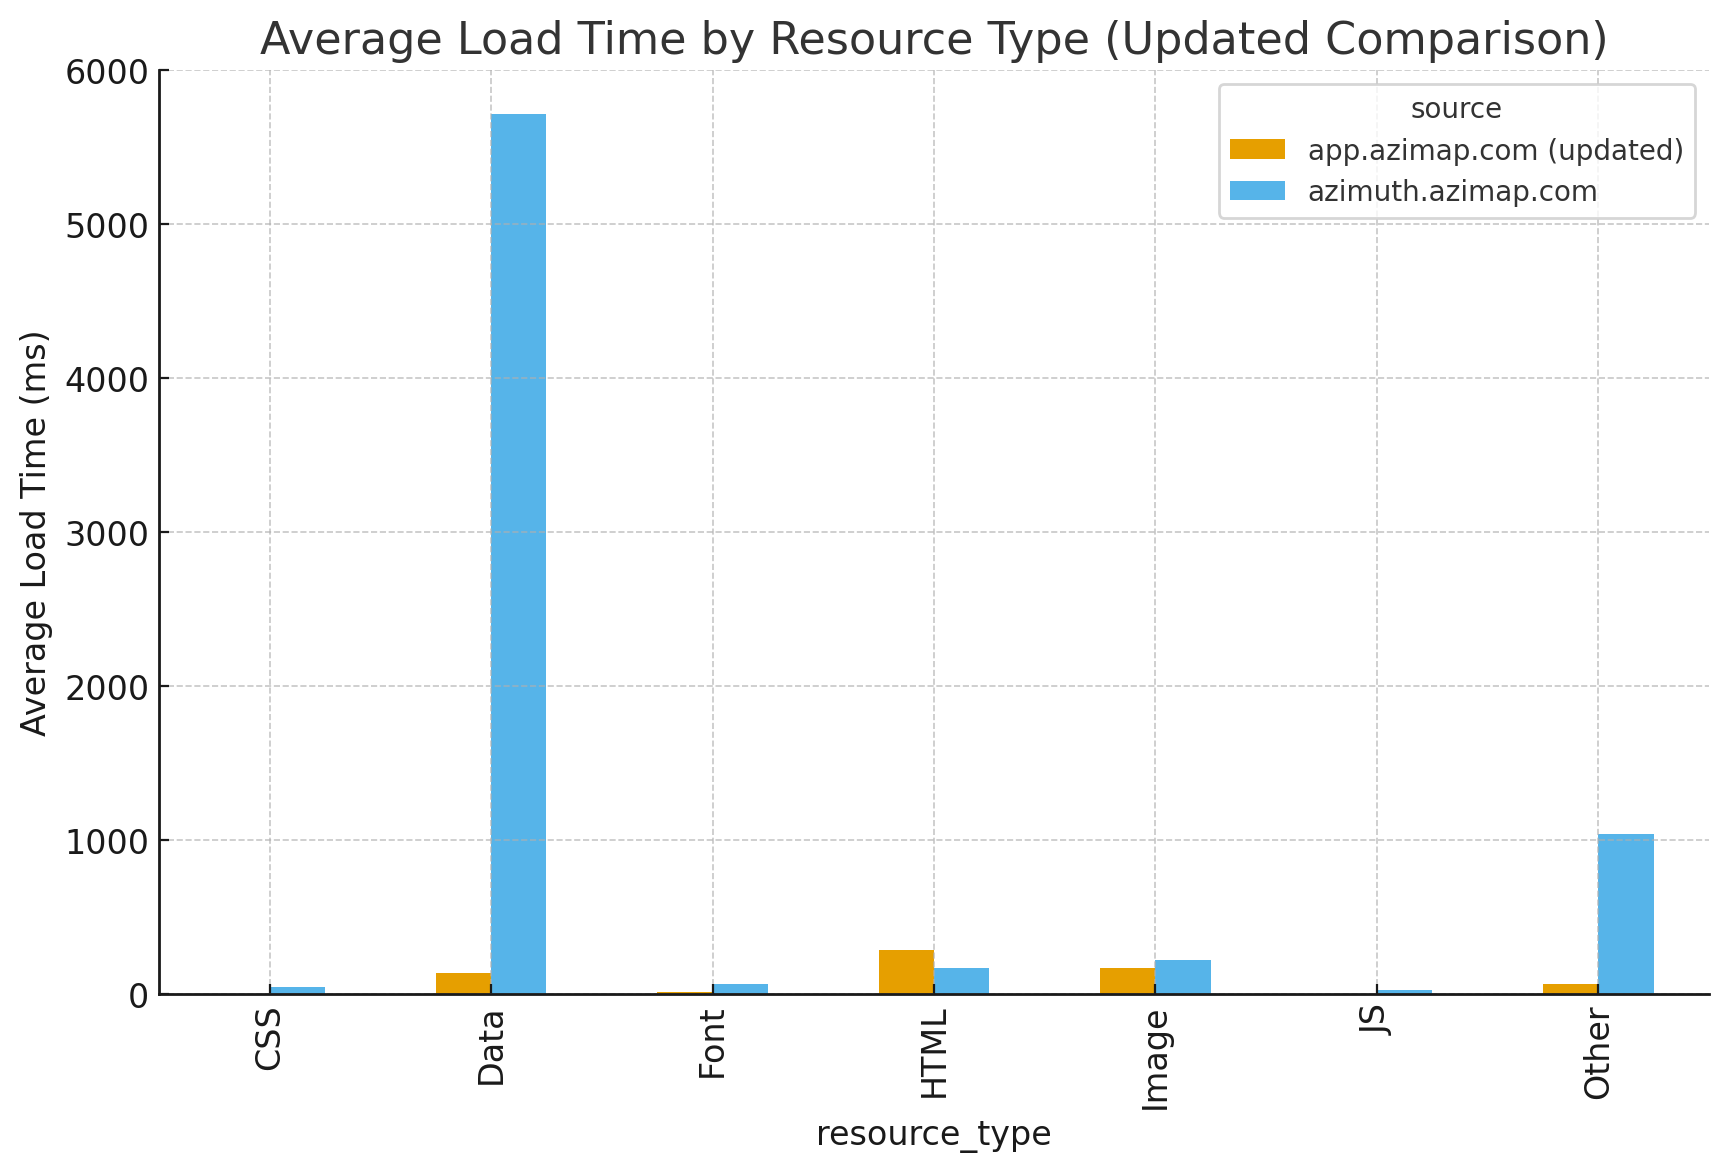
Massive speed improvements on initial load and data load
Optimized requests and caching reduce first paint and subsequent data fetch times—noticeably faster on big projects.
Security improvements through secured API
All endpoints are hardened with modern auth, scoped permissions, and better auditing to protect data in multi-user environments.
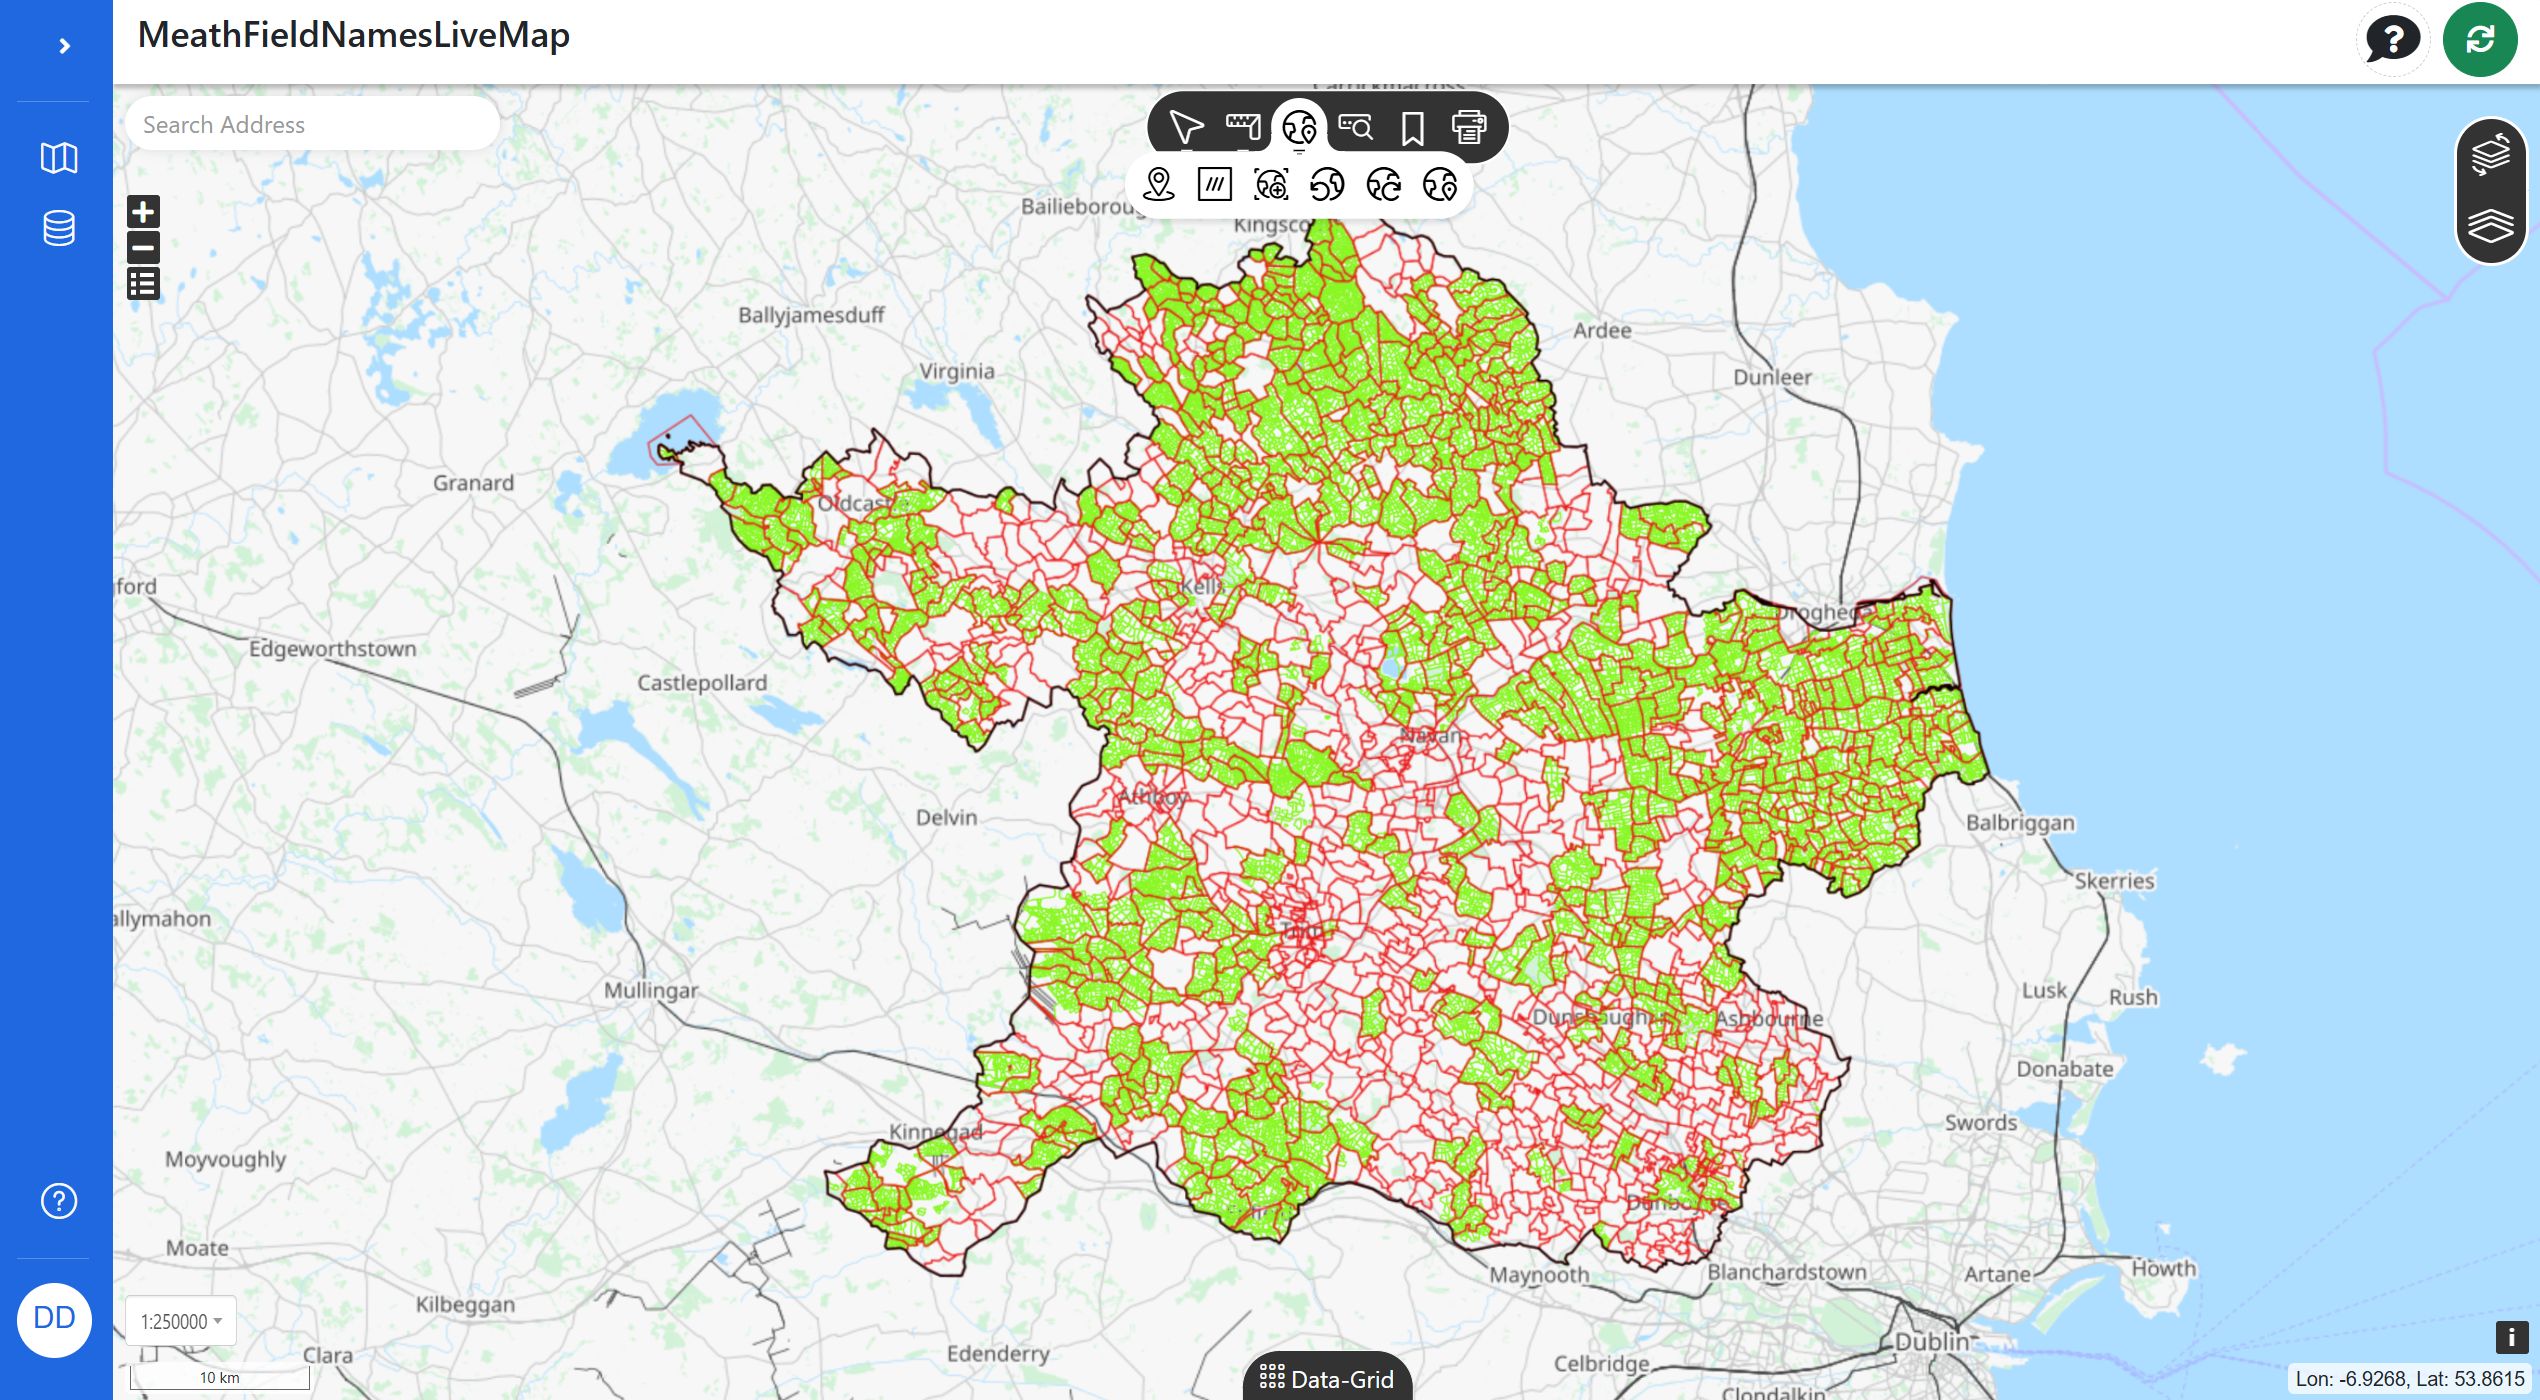
Upgraded UI (completely new)
A refreshed layout, compact tool groups, and cleaner panels make everyday tasks faster and more discoverable.
Tools
Group: Select
- Select: Click features to inspect or prep for edits.
- Box Select: Drag a rectangle to select many at once.
- Freehand Select: Sketch a custom boundary for precise selection.
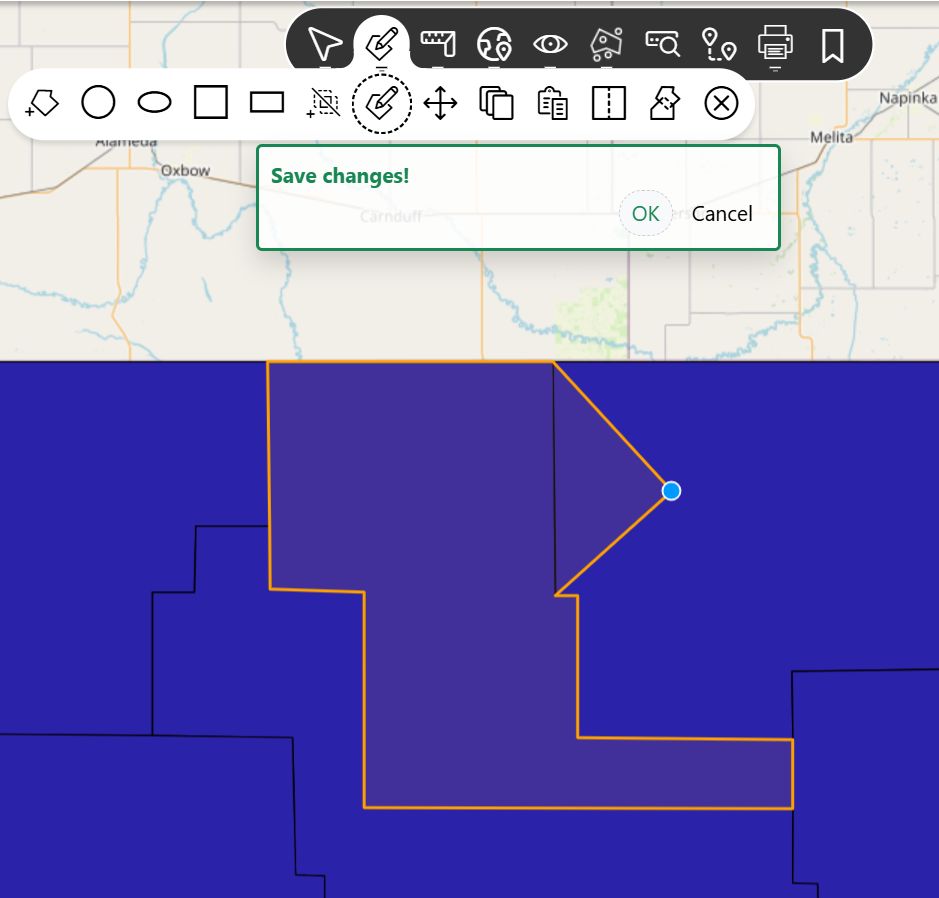
Group: Edit
- Draw (circle, oval, square, rectangle): Create precisely typed features.
- Auto-crop (no overlaps): New polygons won’t overlap existing ones.
- Edit vertices: Move/add/delete nodes for exact geometry edits.
- Move/turns (rotate): Reposition or rotate selected features.
- Copy / Paste: Duplicate or move features across layers/sessions.
- Split / Merge: Divide or combine geometries as needed.
- Delete: Remove selected features.

Group: Measure
- Line: Distance along straight/segmented paths.
- Polygon: Area and perimeter.
- Dimensions of existing features: Click an object to read measurements immediately.

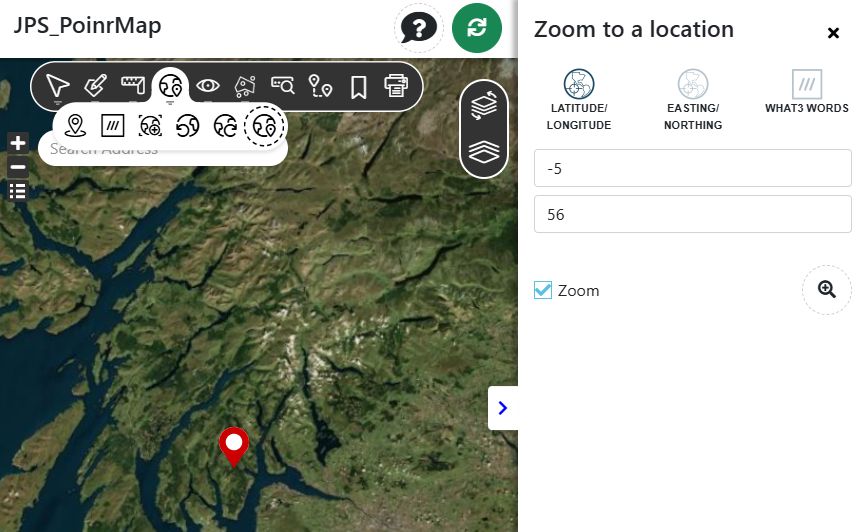
Group: Zoom
- My location: Center on your current device position.
- w3w: Jump via a what3words address.
- Map extent: Fit to project or saved extent.
- Last/Next selected feature: Step through selections with auto-zoom.
- Zoom to coordinate (any projection): Recenter from coordinates in multiple CRSs.
Group: Visualisation
- Streetview: Open street-level imagery at the clicked spot (where available).
- Swipe line (layer comparison): Drag to compare two layers side-by-side.
- Add temporary GeoTIFF: Drop a GeoTIFF for session-only inspection.
- GeoJSON/SHP imports to session: Bring local data in without publishing.
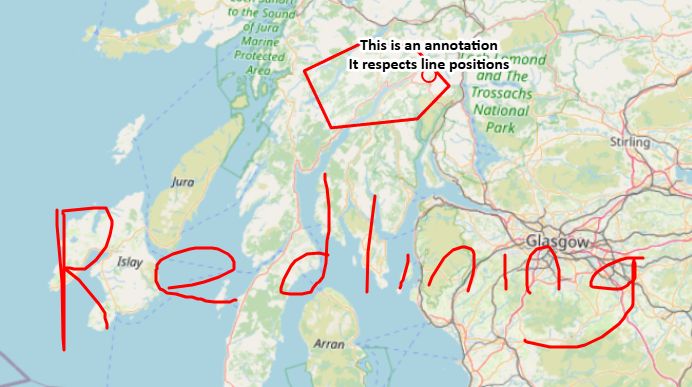
Group: Sketch (redlining)
- On/Off: Toggle markup mode.
- Point/Line/Polygon/Square/Rectangle/Circle/Freehand: Rapid map annotations.
- Annotate / Edit annotations: Add/edit text callouts.
- Delete one / Delete all: Clear selectively or fully.
- Reload from localStorage: Restore your last markup session.
- Import / Export: Share or reuse redlines.
Group: Analysis
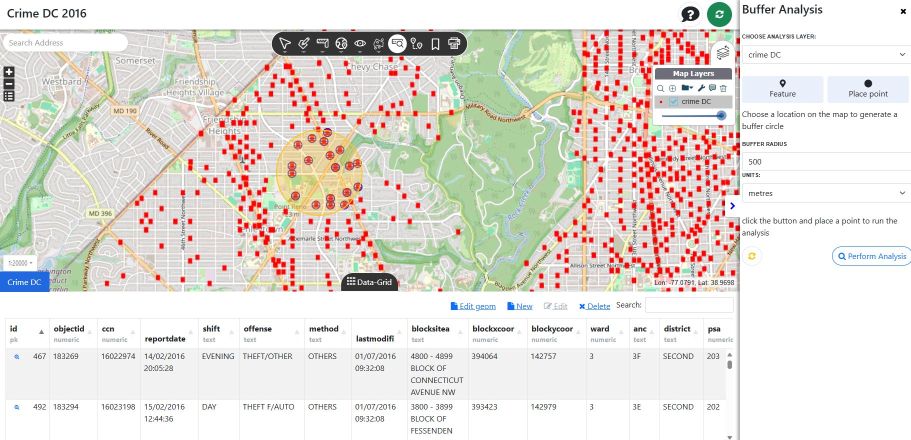
Sub group: Spatial — analyse and filter data
- Intersects, Buffer, Within, Contains, Overlaps, Touches: Core spatial predicates to find related features or build proximity rings.
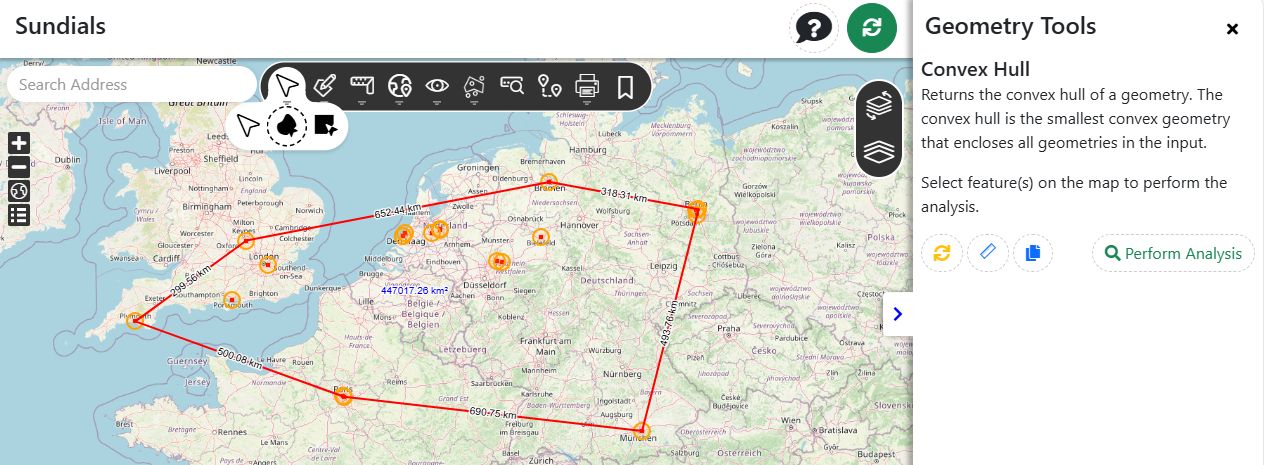
Sub group: Geometry tools — use your data to create new insight/data
- Union, Difference, Envelope, Centroid, Point on surface, Intersection, Symmetric difference, Convex hull, Concave hull, Polygonise (Postgres), Shortest line, Longest line, Minimum bounding circle: Derive analytical geometries for summaries, coverage, and topology cleanup.
Sub group: Quick
- Proximity, Selected feature, Freehand: Instantly produce exports of intersecting visible features across all layers for the defined area/selection.
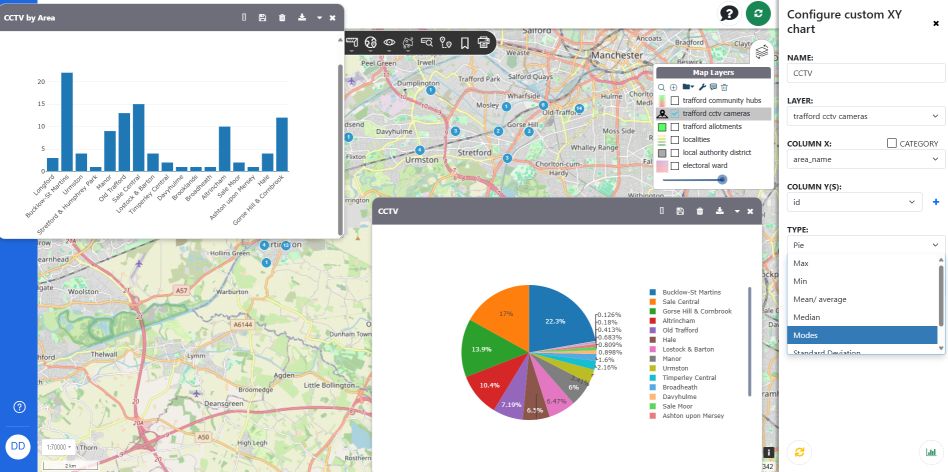
Sub group: Chart — draggable windows, savable to map (per-user dashboards)
- Row count: Quick totals by layer/filter.
- Custom X & Y: Ad-hoc charts from attribute fields.
- Time series: Trends over time for temporal attributes.
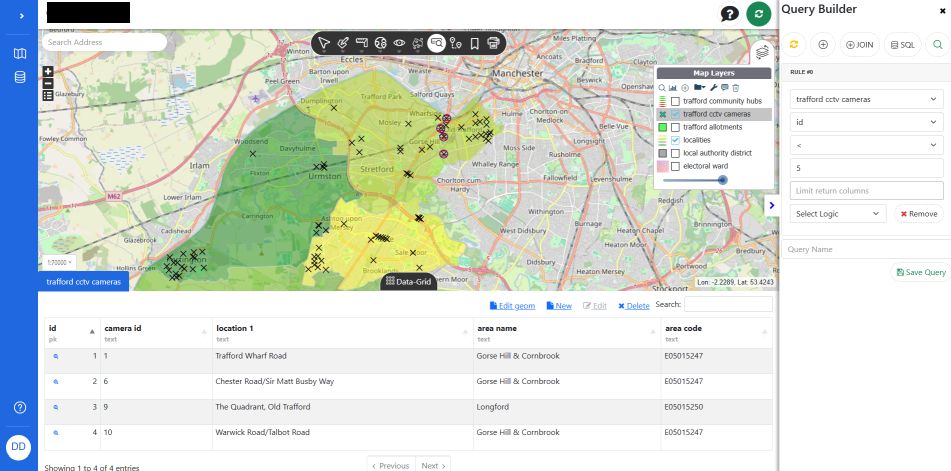
Sub group: Advanced query builder
Build SQL-style queries via GUI, including joins—save and rerun without writing code.
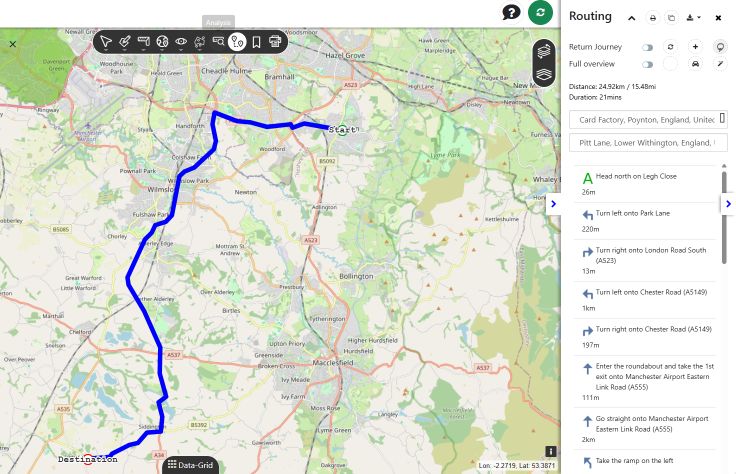
Group: Network & routing
- Routing: Turn-by-turn routes with printable instructions and GPX export.
- Network analysis (car/foot): Isochrones, reachability, and path tests.
- Speed limits on roads API: Enrich routing with OSM-based speed metadata. (All based on OSM data.)
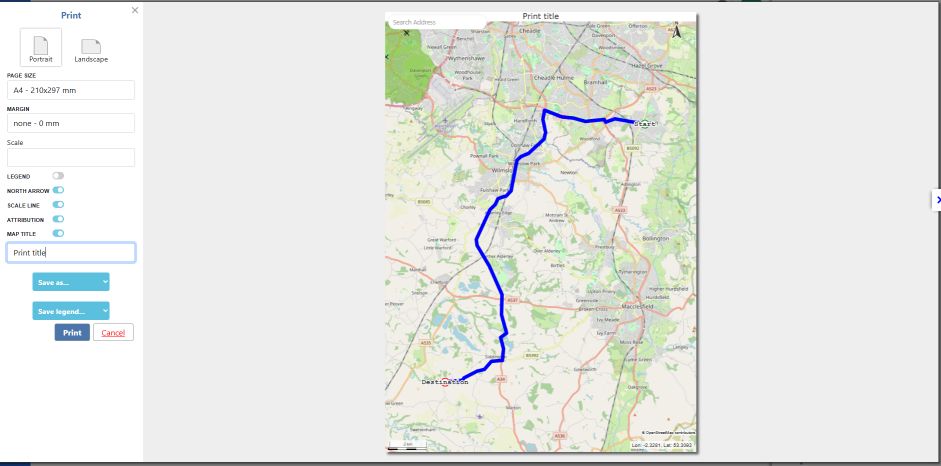
Group: Printing
- Print on interactive map with added tiles and display artefacts: True WYSIWYG—what you see is what you print, including overlays and styling.
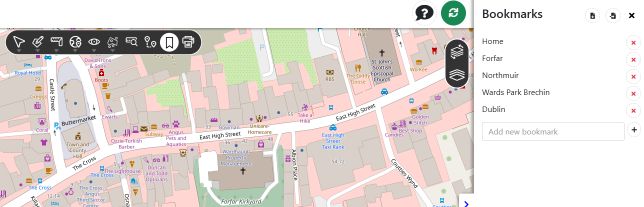
Group: Bookmarks
- Set geospatial bookmarks on the map or your user session, and share with other users for collaboration.
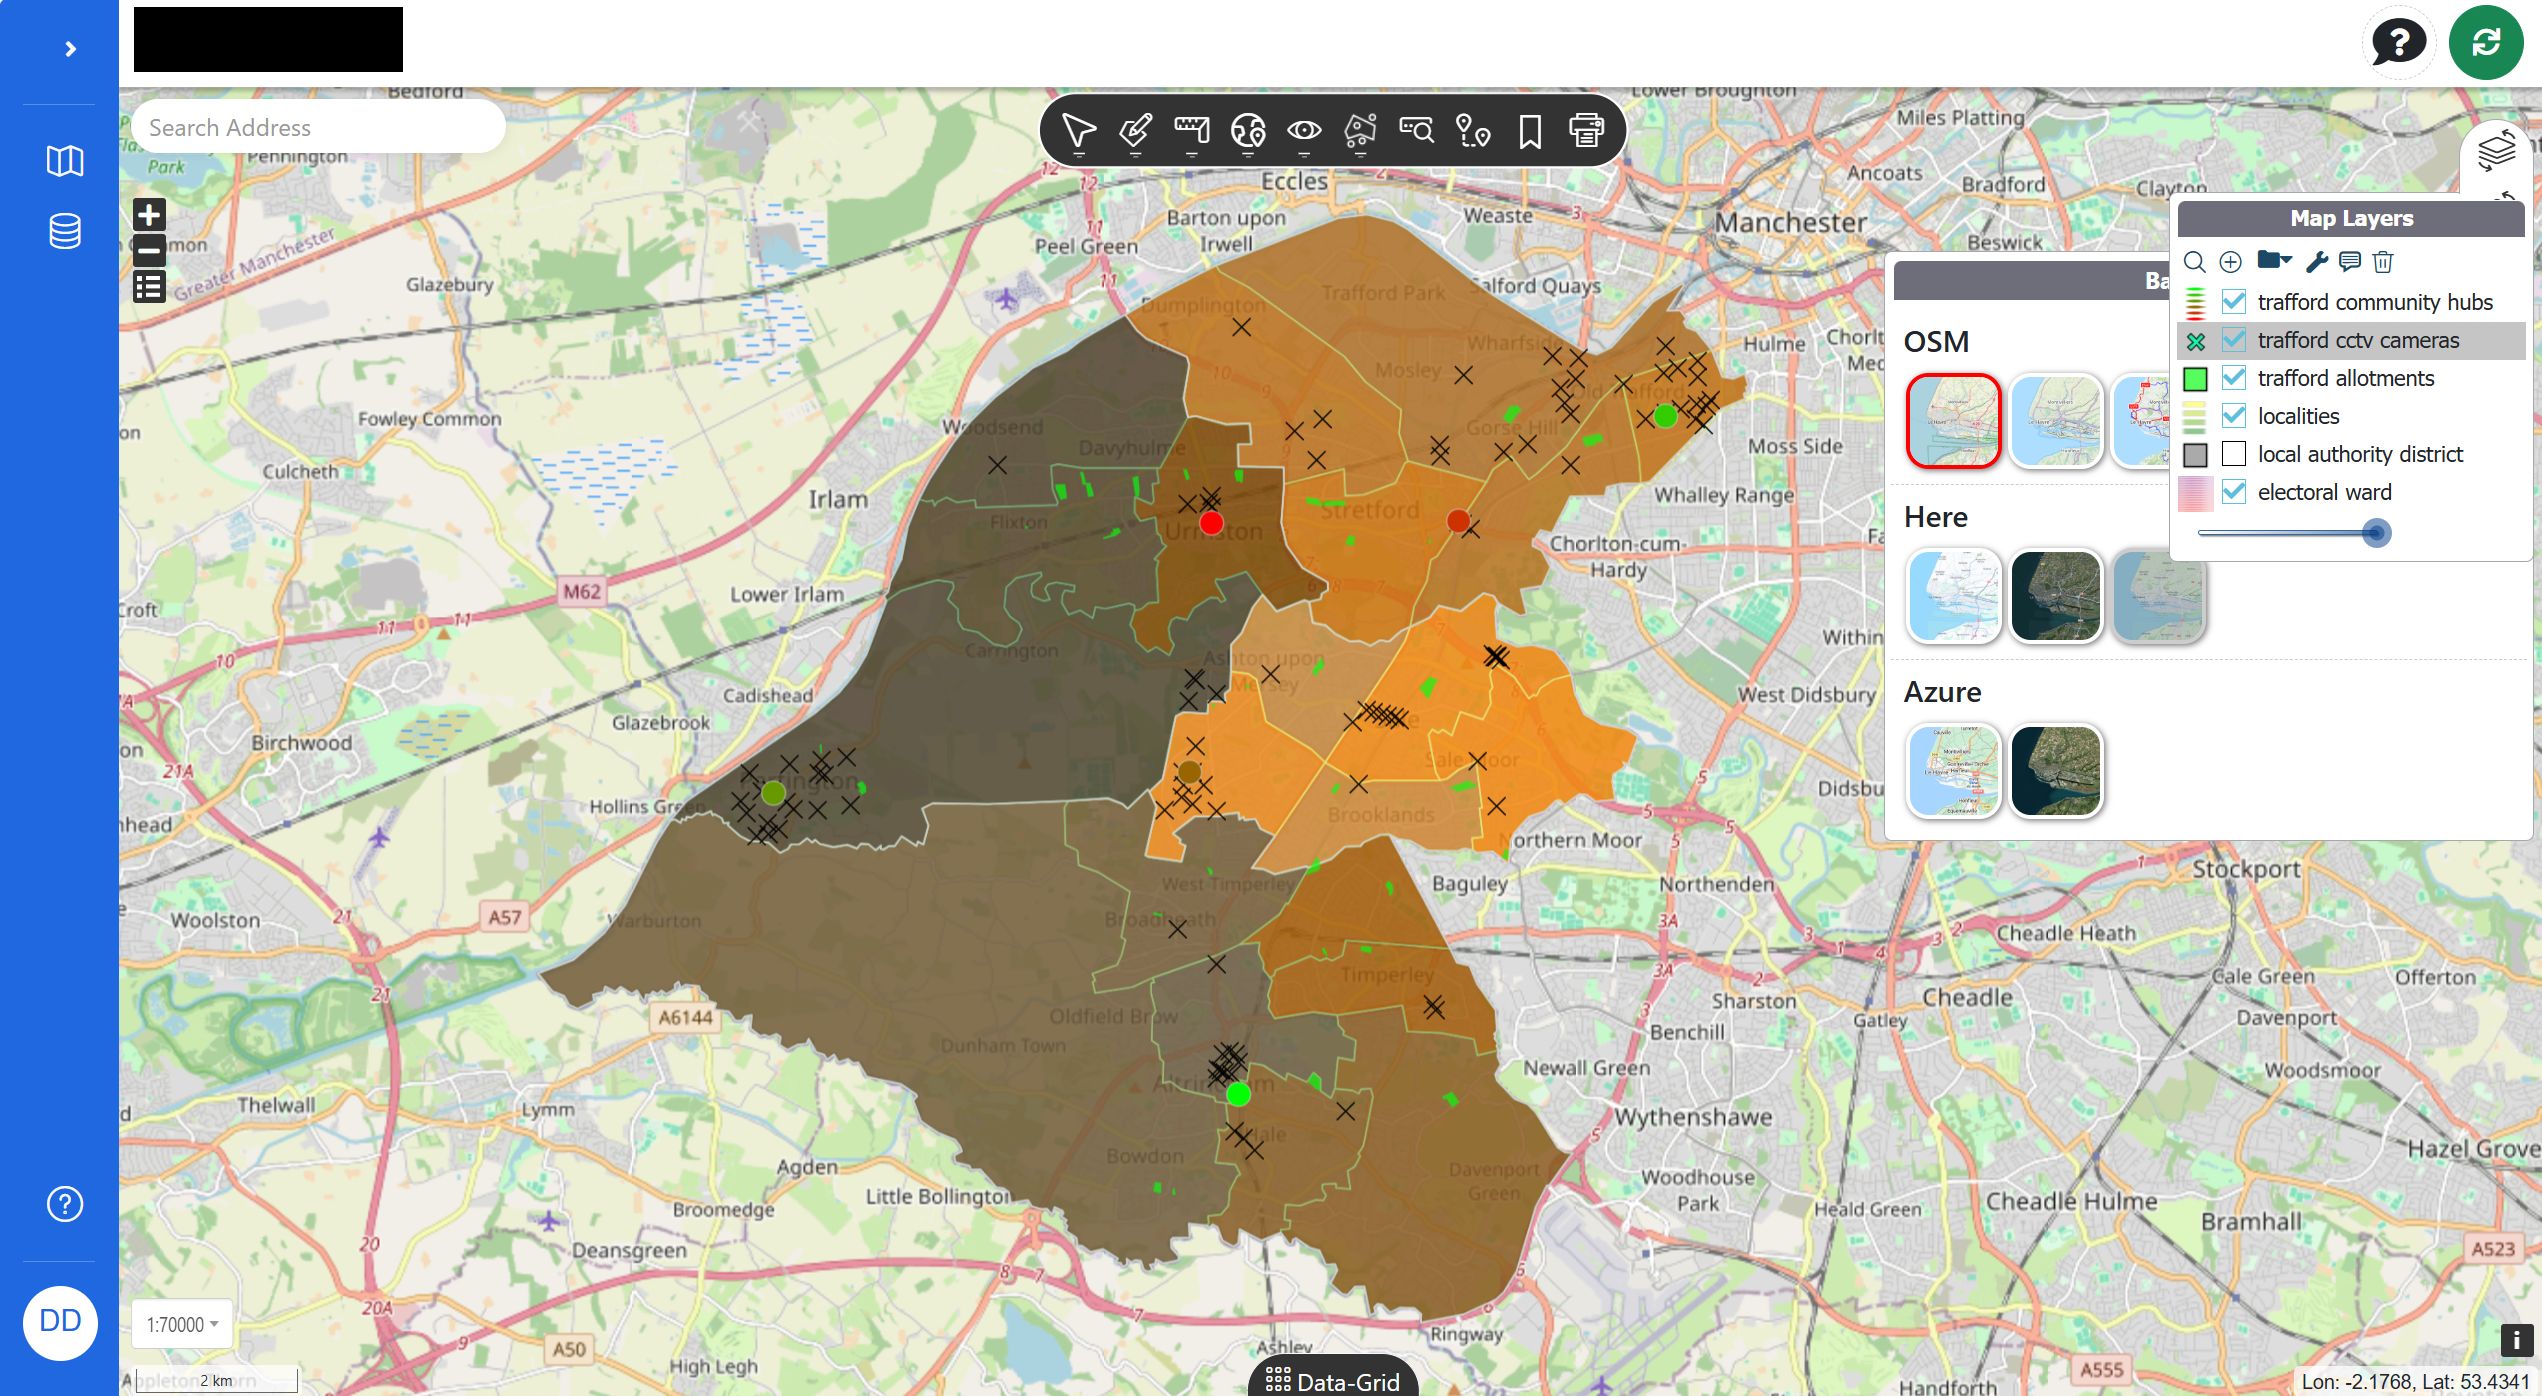
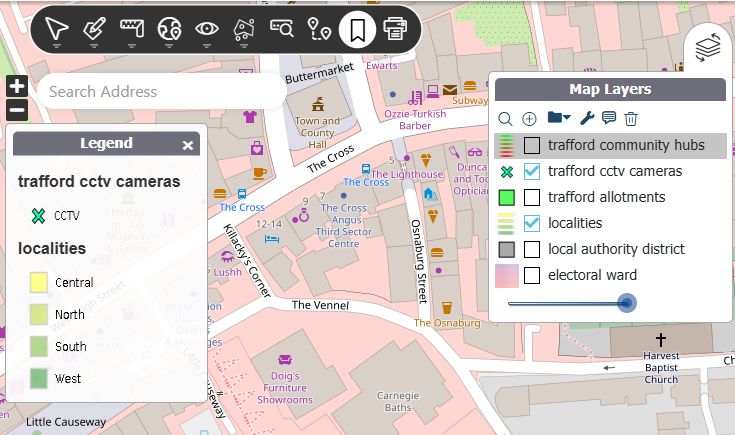
Other map improvements
- New legend with clearer symbology.
- Layer chooser with: Zoom to layer, Add layer, Delete layer, Add group, Edit layer properties, Edit layer attribute properties.
- Base layer chooser with previews for quick visual selection.
Rewritten data grid
A brand-new grid designed for speed and clarity on large tables.
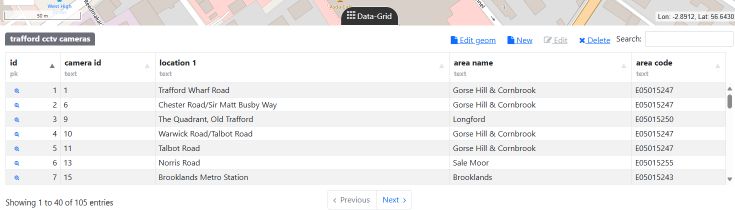
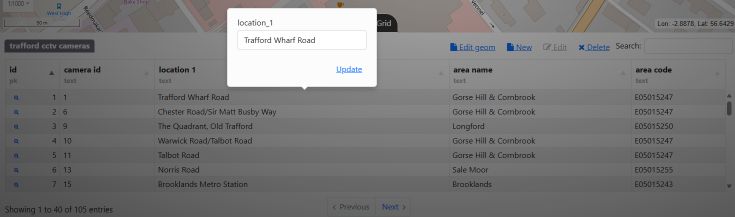
Allows inline editing, exports in multiple formats with projection change
- Inline editing for rapid updates.
- Export to multiple formats.
- Projection change during export for downstream compatibility.
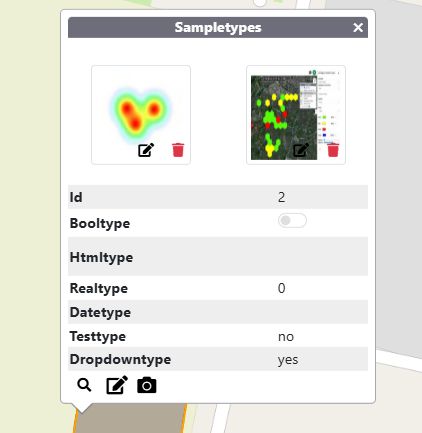
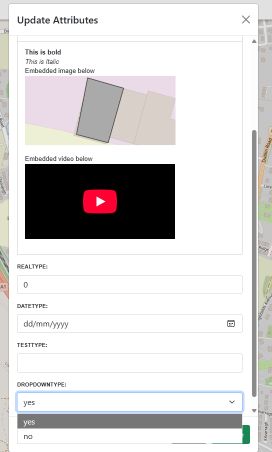
New data entry form with validation for all types
A robust form system validates every field type to keep data clean at source.
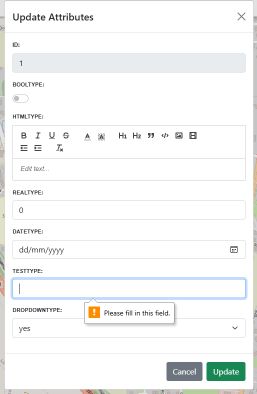
New HTML data type with WYSIWYG editor supporting video/images and formatted HTML
Capture rich content directly in attributes—formatted HTML, images, and video—via the built-in editor.
Attach documents and images to features
Keep context with your data by attaching files and images to features.