Import Non-Location Data And Digitise on a Map
In this guide we will show you
how to create a new map and import a spreadsheet for adding features to the
spreadsheet.
Time to complete: 15 mins.
Contents
1. Getting started
1.1 Download files
1.2 Convert Excel file to CSV
1.3 Create a new map
1.4 Upload your data onto the map
2. Configuring
your imports
2.1 Setting
your coordinate system (EPSG)
2.2 Configuration
3.
Add features
to the map
3.1 Using ‘digitising’ mode
3.2 Digitising the rest of your data
1. Getting started
1.1. Download files
Download the sample file: Sample Excel.
The zip file contains 1 Excel
file with an ID and a String.
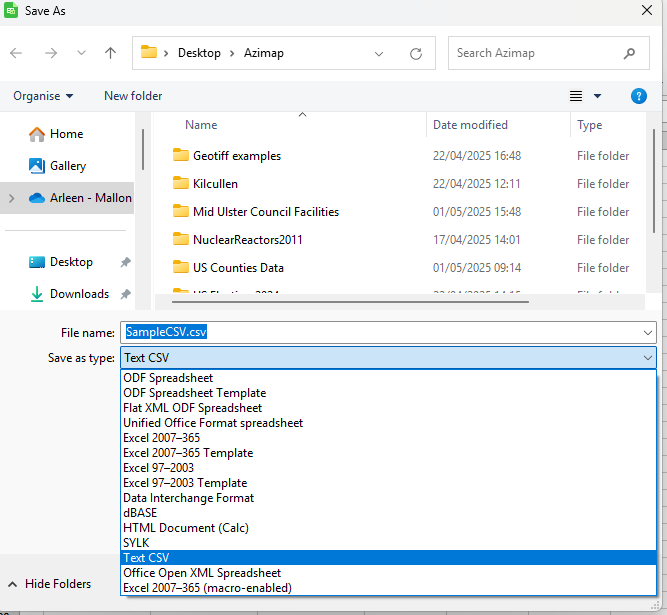
1.2. Convert Excel file to CSV
Open the file in Excel or LibreOffice. Next, choose FILE & SAVE AS from the top
menu and save it as a CSV (Comma Delimited_ (*.csv) file.
1.3.
Create a new map
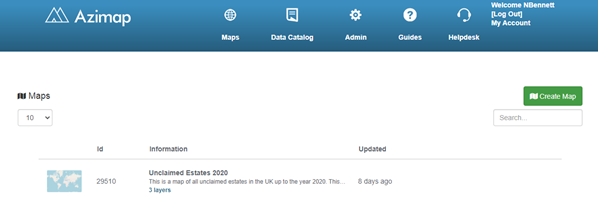
Click on MAPS section and select
CREATE MAP.
This will open up the first page of the
map creation wizard.
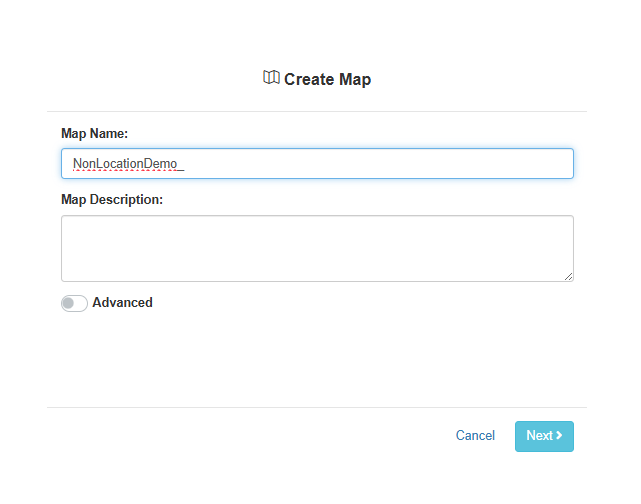
Name your new map and select NEXT.
1.4.
Import data and add to map
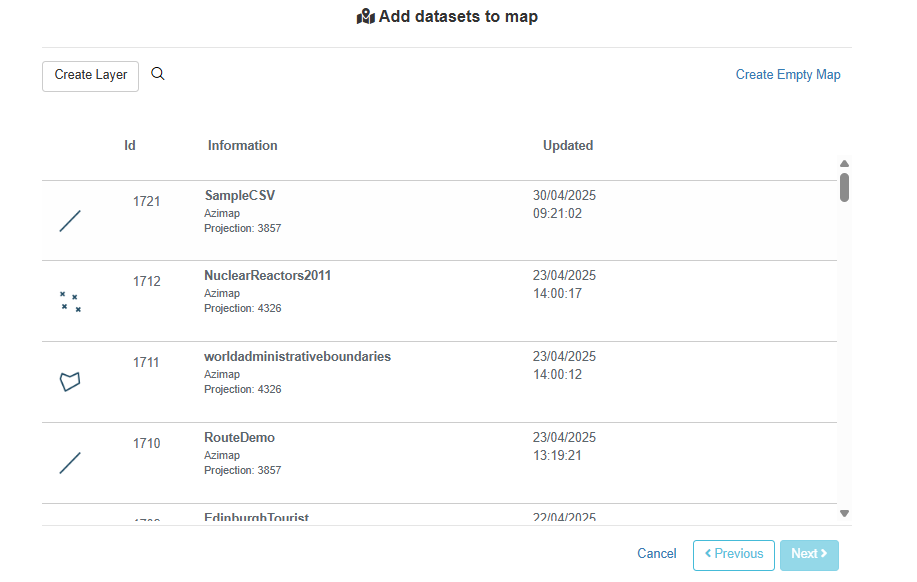
At this stage you have a number of
options. You can create a brand new layer for your map by selecting the CREATE
LAYER button. Alternatively you can choose to upload one or many of your
existing layers onto your map (your full list of layers will appear), or you
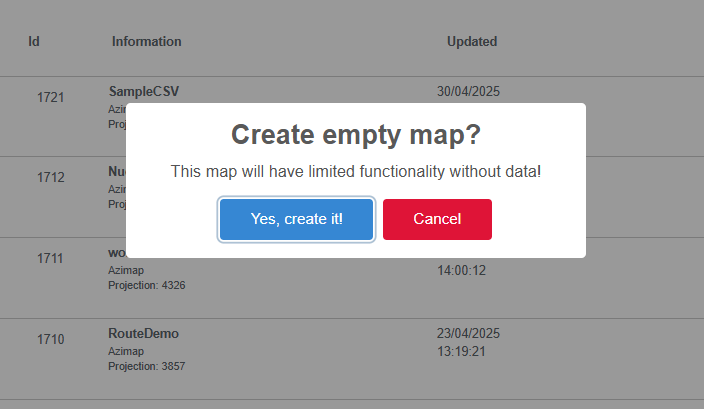
choose to create an empty map.
When you try to load a map without
any layers attached you will get the below warning.
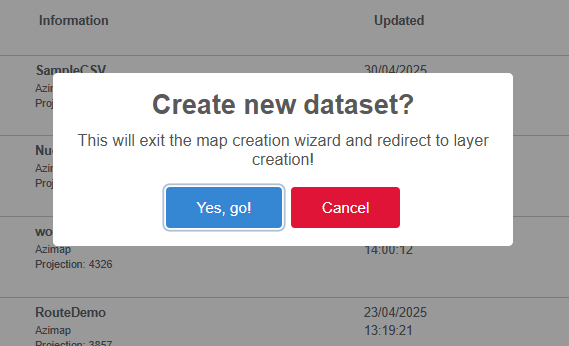
In this case however, we'll choose
the CREATE LAYER button (this is also accessible on the map using the gears
button on the layer tree view). You'll be prompted with the below
pop-up. Select YES, GO.
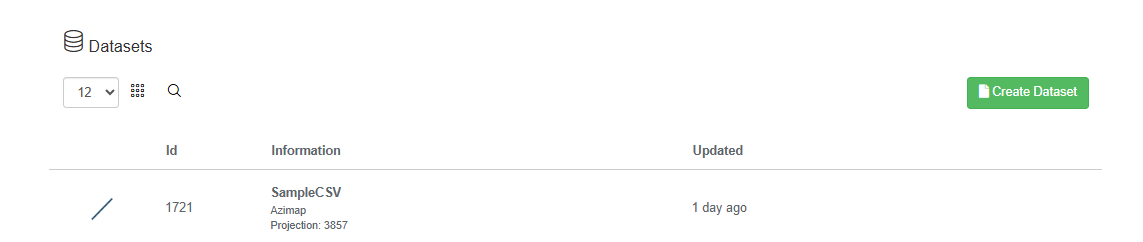
This will automatically bring you to
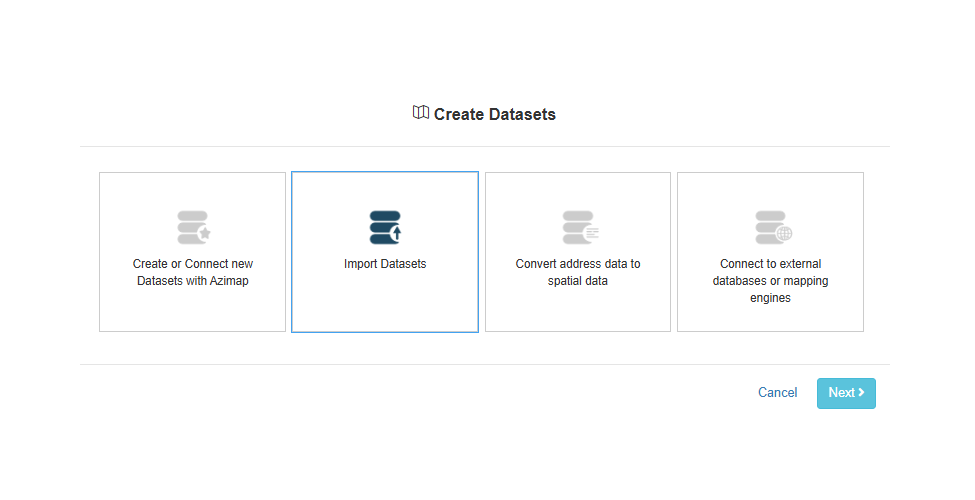
the first step of the CREATE DATASETS wizard.
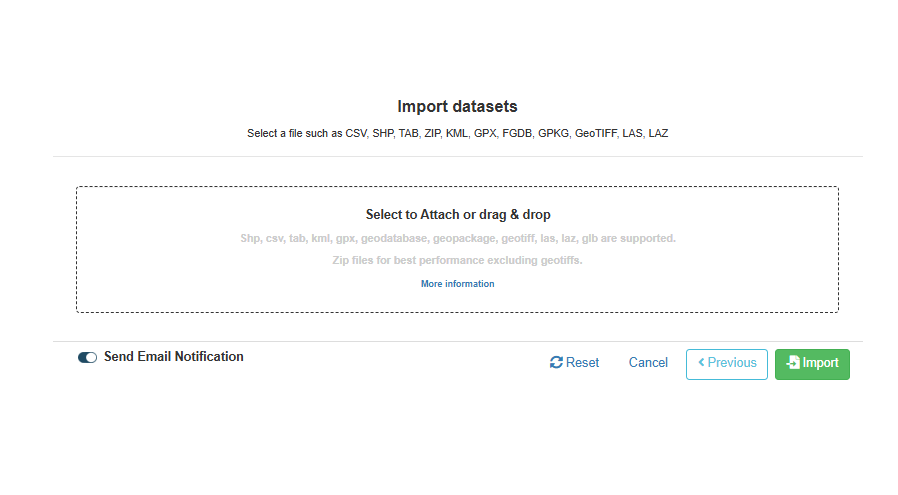
Choose IMPORT DATASETS.
Drag and drop the earlier downloaded
zip file.
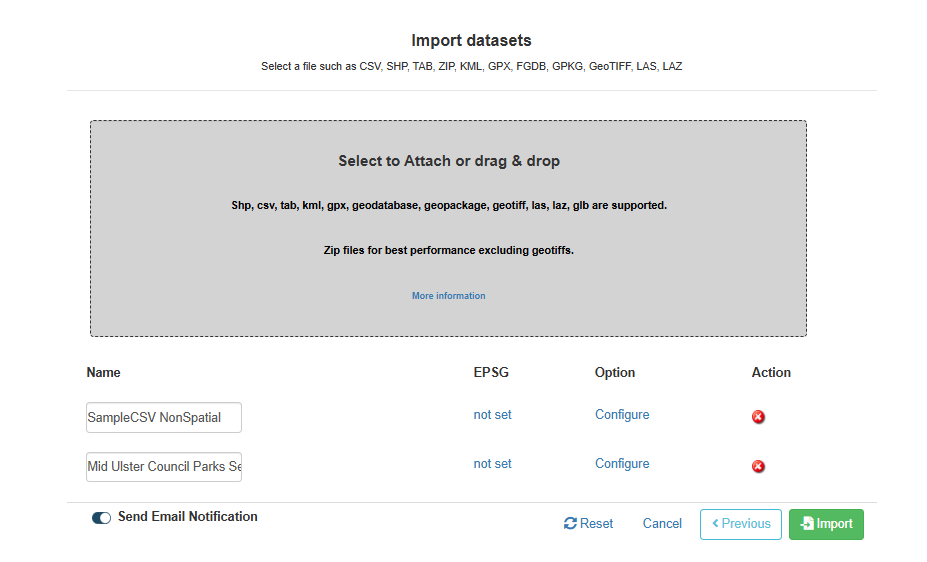
Rename your layers after you upload them.
2. Configuring your imports
After upload,
CSV imports need to be configured.
1.
2.
2.1. Setting your coordinate system (EPSG)
- Set EPSG
code - All spatial data needs a co-ordinate system (this is recognised
automatically for spatial files like SHP or TAB but must be set manually for
CSV) further information on EPSG codes available here
- Each
Country will have its one or many of its own EPSG codes (GB: 27700, Ire: 2157)
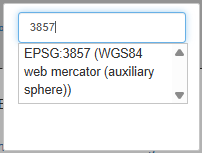
- Search
can be processed by EPSG code or by name
- Search
for 4326 and select (EPSG:4326 is a worldwide coordinate system measured in
degrees)
- Spatial CSV has a EPSG code of 'EPSG:3857' which covers worldwide and is the same as our basemaps (Google, Bing, OSM)
2.2. Configuration
Under the OPTIONS section, click the CONFIGURE
button. You’ll be presented with the
following three options.
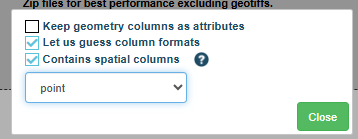
Here’s what they all mean:
KEEP GEOMETRY COLUMN AS ATTRIBUTES (not applicable for this purpose) – this will create a new column in with text version of the
geometry (lat lon or Well Known Text (WKT)) - useful for point features but a
WKT of lines or polygons can be very large
LET US GUESS COLUMN FORMATS - our importer
will try to auto discover the types in each column (string, text, date etc.). If unticked, all data will be imported as
string unless a .csvt file is used.
The .csvt file
has to have the same name as the .csv file it describes. It enables definition
of the following data types: Integer, Real, String, Date (YYYY-MM-DD), Time
(HH:MM:SS+nn) and DateTime (YYYY-MM-DD HH:MM:SS+nn) and geometry column
types (WKT, lat, X, lon, Y). A .csvt file contains only one line and the types
for each column need to be quoted and comma separated, e.g.
- Precision can also be applied
"Integer","Real","String(500)"
CONTAINS SPATIAL COLUMNS
Tick this if
you know that your CSV has a spatial (location data) column, e.g.
- This CSV does not have location data so this should be unticked
- Supported column names are:
- WKT - short for Well Known Text. Details of format
available here. The type supports almost all geometry types including points,
lines, polygons, and their multi variants
- Lat or Y - lat of y for the Y axis point coordinate
- Lon or X - lon of x for the X axis point coordinate
SELECT GEOMETRY DROP DOWN
- Choose point, line or polygon
- For non-spatial CSV you can choose the format you want to capture = point
Close and click
SAVE.
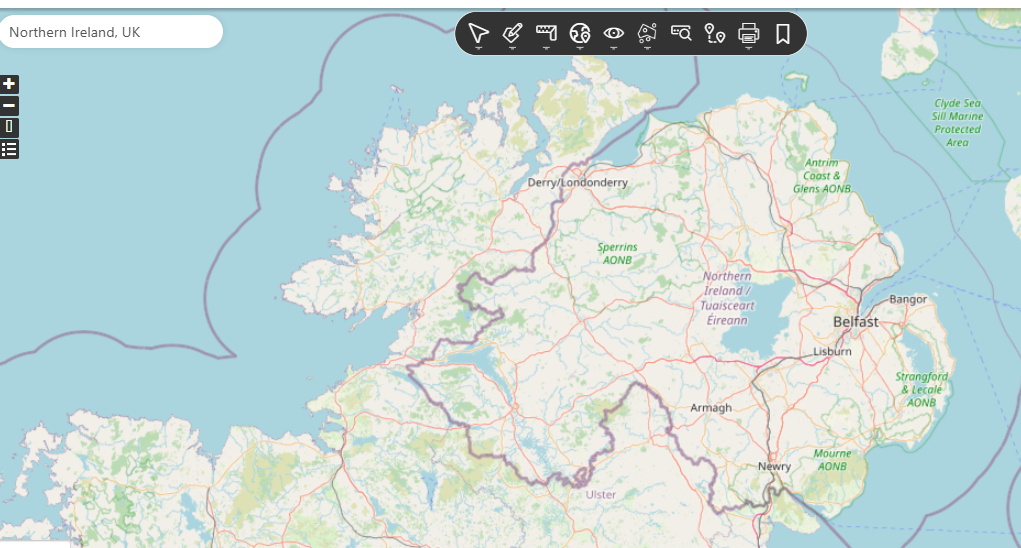
Your new layer will be added to the map, as there is no data in the
layer it will default to the centre of the coordinate system (somewhere in the
Atlantic)
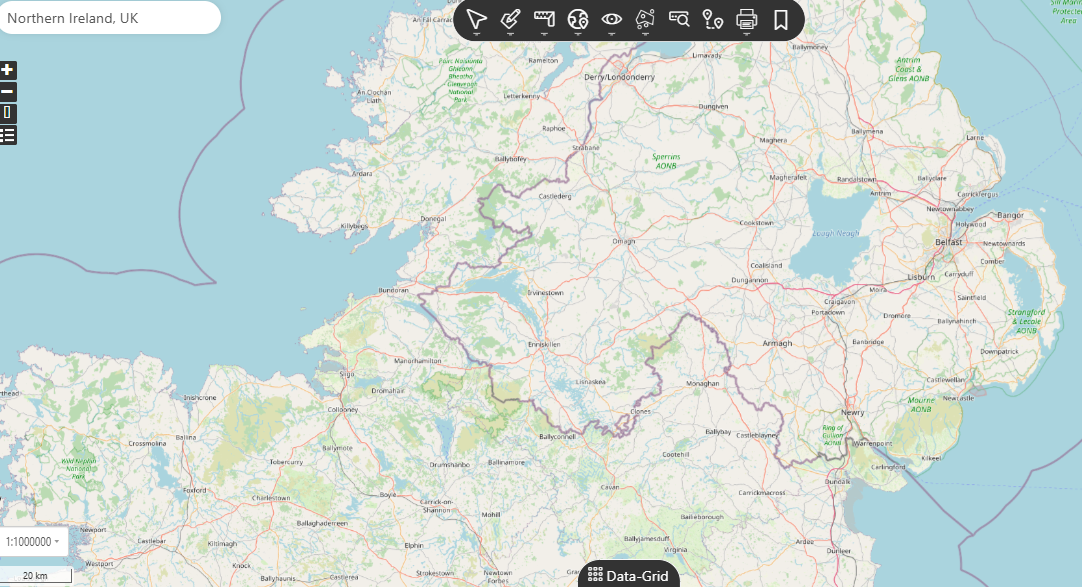
Use the address bar in the top right of the map to search for
'Northern Ireland'
3. Add features to the map
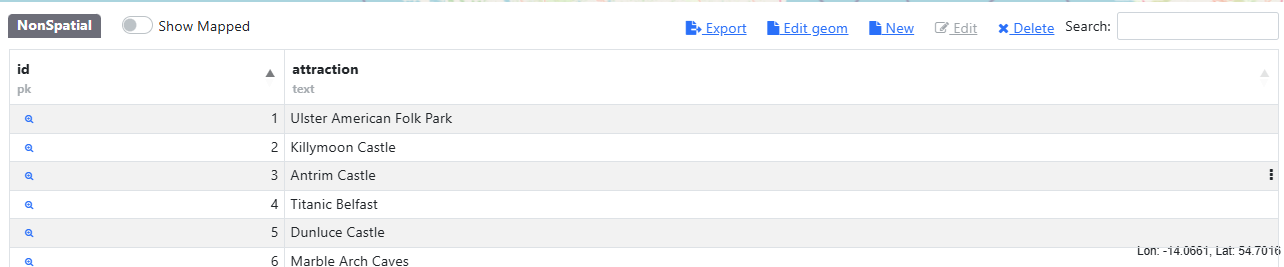
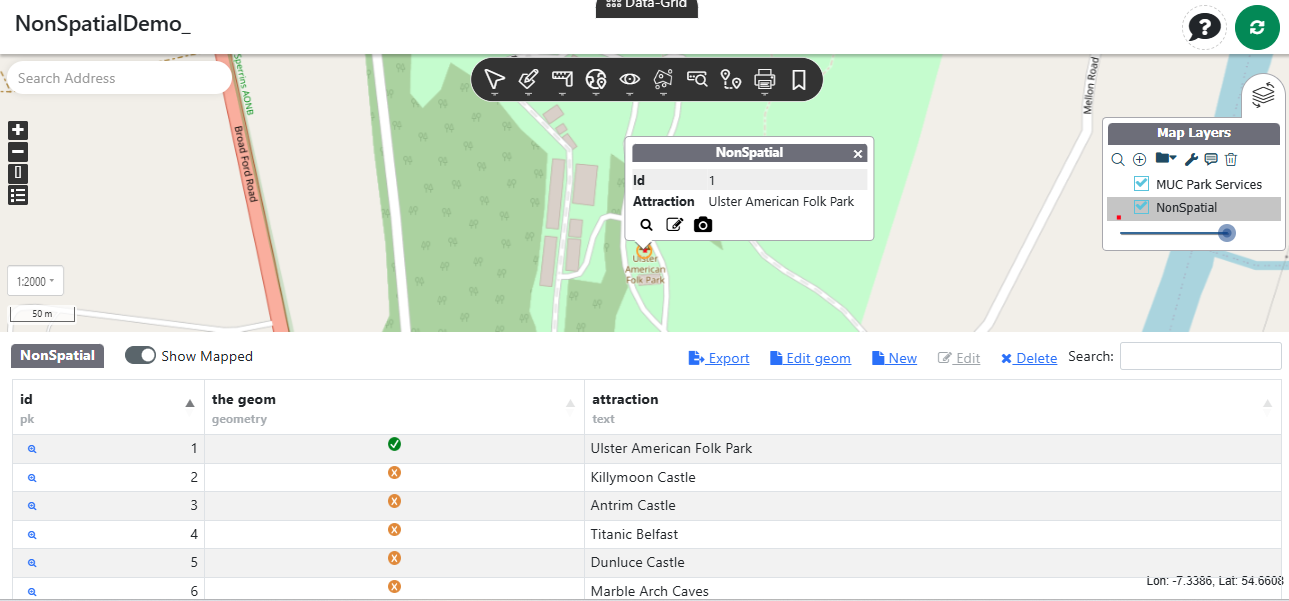
To facilitate fast digitising, Azimap has a geocoding workflow click on 'Data Grid' located at the very bottom of the screen.
This will open the data panel at the bottom of the screen where all the
imported data will be listed. On the
left of the panel each row has a DIGITISE button which, when clicked, will
change the map to digitising mode – making it easy to transfer your features
digitally onto the map.
2.
3.
3.1. Using ‘digitising’ mode
Firstly, click on the first row DIGITISE button.
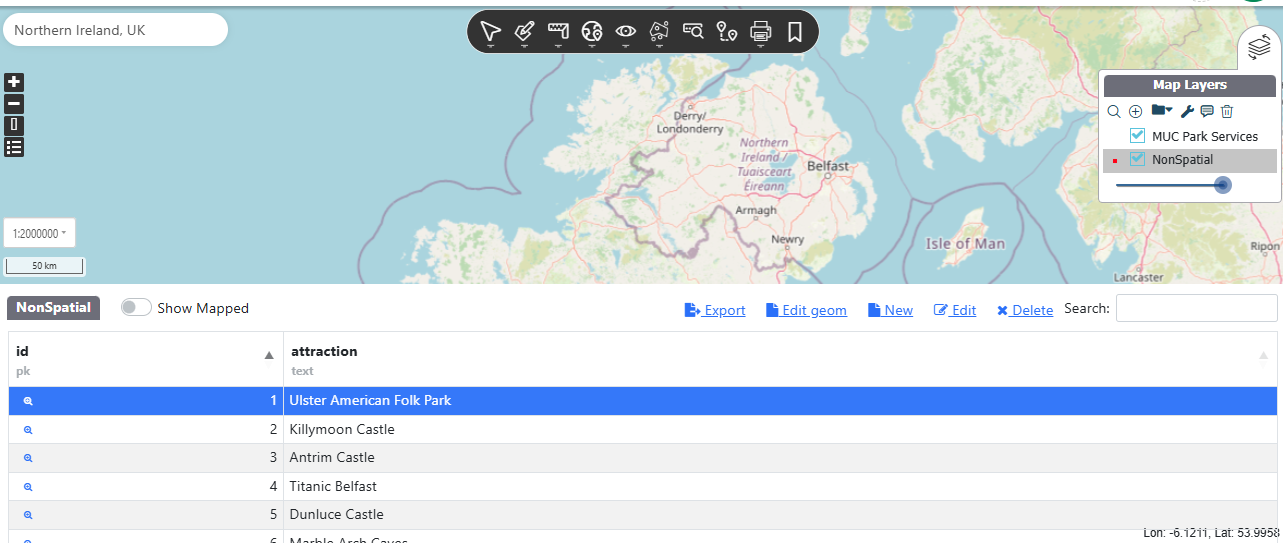
This will convert the toolbar to 'digitising' mode.
This dataset is the top 10 attractions in Edinburgh. As you can see, the number 1 attraction is
Ulster American Folk Park, in Omagh. Use the address search in
the top left of the map to search for 'Arthur's Seat'.
This will zoom the map to the correct location.
Select EDIT GEOM button on the toolbar.

Click the map at the correct location to place a point.
A message will appear asking "are you sure!".
Once you have your location marked, click 'ok'.

The toolbar will revert to normal and the former "The Geom" will be
changed from a yellow x  to a green tick
  , to highlight a digitised record.
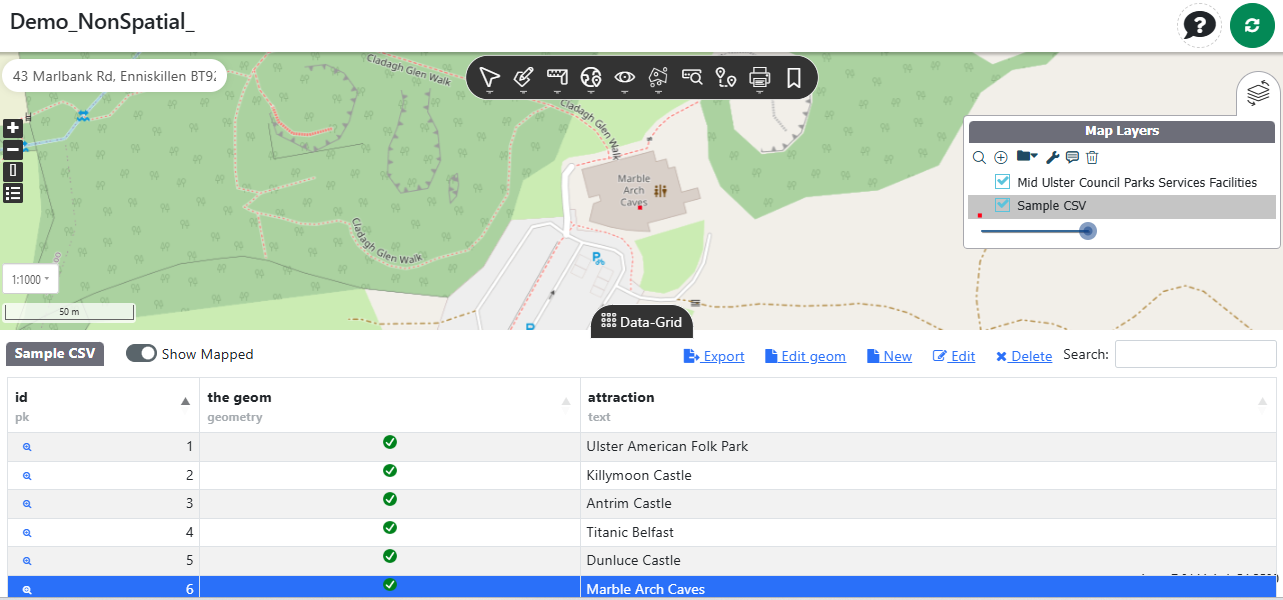
3.2. Digitising the rest of your data
Repeat step 3 for all features.
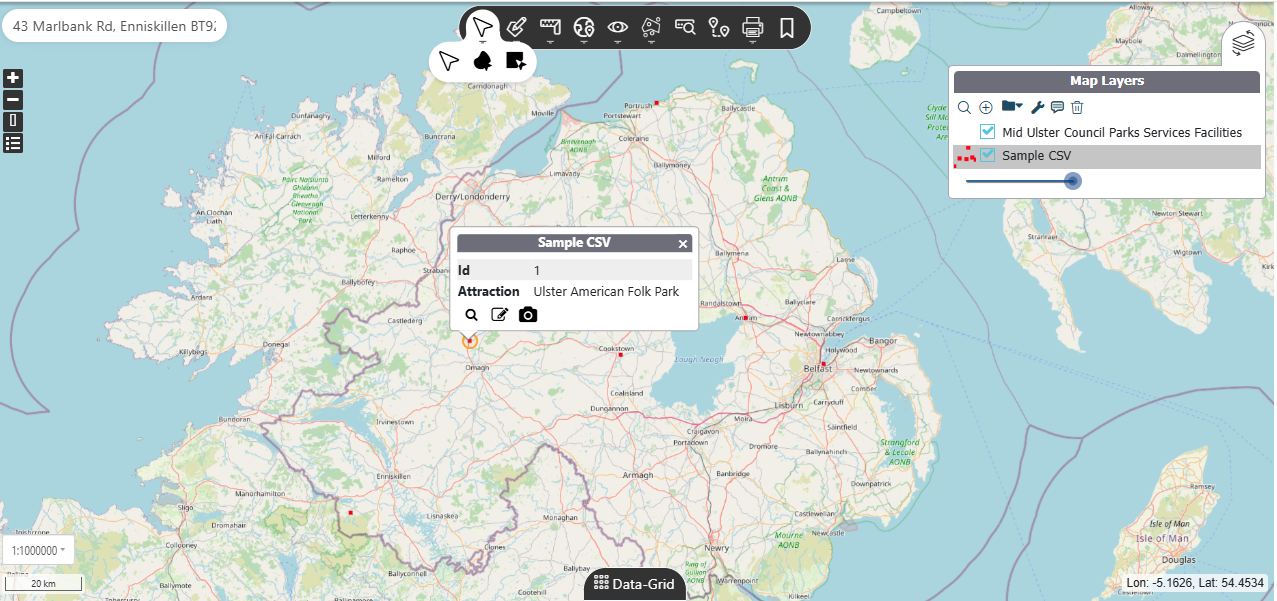
All the yellow buttons should turn green and your data is now spatial!
Once all data has been digitised, they will appear on the map as red dots.
Thanks for reading and if you haven't yet tried Azimap please go to
the website to REGISTER.